
Page 65 - 2020년김해시통계연보
P. 65
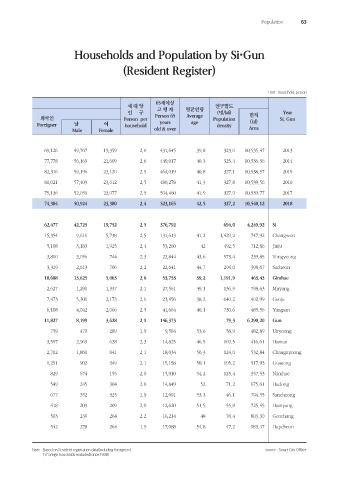
Population              63


                           Households and Population by Si·Gun

                                            (Resident Register)


                                                                                               Unit : household, person
                                                        65세이상
                                              세 대 당     고 령 자     평균연령       인구밀도
                                              인     구                        (명/㎢)       면적         Year
               외국인                           Person  per   Person 65   Average  Population   (㎢)   Si, Gun
              Foreigner    남         여       household   years      age      density
                           Male     Female             old & over                       Area


                 69,126     49,767    19,359       2.6    431,645     39.8      323.0    10,535.47   2013

                 77,778     56,169    21,609       2.6    449,017     40.3      325.4    10,536.36   2014
                 82,316     59,196    23,120       2.5    464,019     40.8      327.1    10,538.57   2015
                 81,021     57,409    23,612       2.5    480,278     41.3      327.8    10,539.56   2016

                 75,136     52,059    23,077       2.5    504,460     41.9      327.9    10,539.77   2017
                 74,304     50,924    23,380       2.4    523,165     42.5      327.2   10,540.12   2018


                 62,477     42,725    19,752       2.5    376,792               694.0   4,249.92   Si
                 15,354     9,616      5,738       2.5    131,613     41.2     1,429.2   747.92   Changwon
                  5,108     3,183      1,925       2.4     53,260      42       492.5    712.86   Jinju

                  3,800     3,056       744        2.3     22,844     43.6      573.4    239.85   Tongyeong
                  3,319     2,613       706        2.2     22,641     44.7      294.0    398.67   Sacheon
                 18,688     13,625     5,063       2.6     53,753     39.2     1,191.9   463.43   Gimhae

                  2,627     1,290      1,337       2.1     27,561     49.1      136.9    798.63   Miryang
                  7,473     5,300      2,173       2.6     23,456     38.2      640.2    402.99   Geoje
                  6,108     4,042      2,066       2.5     41,664     40.1      730.6    485.56   Yangsan

                 11,827     8,199      3,628       2.1    146,373                79.3   6,290.20   Gun
                   759        470       289        1.9     9,584      53.6       58.9    482.89   Uiryeong
                  3,597     2,969       628        2.3     14,825     46.5      169.5    416.61   Haman

                  2,702     1,861       841        2.1     18,034     50.3      124.0    532.84   Changnyeong
                  1,251       902       349        2.1     15,158     50.1      105.2    517.93   Goseong
                   829        674       155        2.0     15,910     54.2      125.4    357.53   Namhae

                   549        245       304        2.0     14,849      52        71.2    675.61   Hadong
                   677        352       325        1.9     12,091     53.3       46.1    794.55   Sancheong
                   418        209       209        2.0     12,620     51.5       55.8    725.45   Hamyang

                   503        239       264        2.2     16,214      48        78.4    803.30   Geochang
                   542        278       264        1.9     17,088     54.8       47.2    983.47   Hapcheon


            Note : Based on Resident registration data(Including foreigners).                 source : Smart City Officer
                       1) Foreign housholds excluded(since 1998)