
Page 63 - 2020년김해시통계연보
P. 63
Population 61
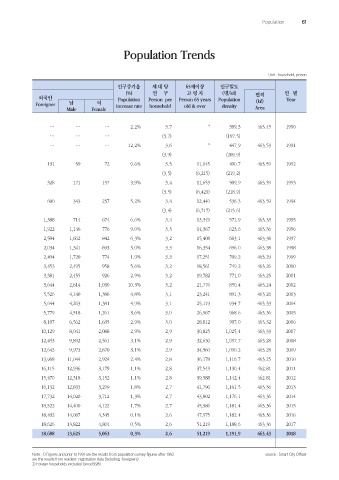
Population Trends
Unit : household, person
인구증가율 세 대 당 65세이상 인구밀도
(%) 인 구 고 령 자 (명/㎢) 면적 연 별
외국인 Population Person per Person 65 years Population Year
Foreigner 남 여 increase rate household old & over density (㎢)
Male Female Area
… … … 2.2% 3.7 * 399.3 463.45 1990
… … … (3.7) (197.5)
… … … 12.2% 3.6 * 447.9 463.53 1991
(3.9) (209.9)
131 59 72 9.6% 3.5 11,045 490.7 463.59 1992
(3.5) (6,215) (219.2)
328 171 157 3.9% 3.4 11,653 509.9 463.59 1993
(3.5) (6,429) (218.9)
600 343 257 5.2% 3.4 12,440 536.3 463.59 1994
(3.4) (6,717) (215.6)
1,388 714 674 6.6% 3.4 13,349 571.9 463.33 1995
1,922 1,146 776 9.0% 3.3 14,367 623.6 463.36 1996
2,504 1,662 842 6.3% 3.2 15,408 663.1 463.38 1997
2,034 1,341 693 5.0% 3.3 16,354 696.0 463.38 1998
2,494 1,720 774 1.9% 3.3 17,251 709.2 463.29 1999
3,453 2,495 958 5.6% 3.2 18,561 749.2 463.26 2000
3,381 2,455 926 2.9% 3.2 19,782 771.0 463.25 2001
3,644 2,614 1,030 10.3% 3.2 21,776 850.4 463.24 2002
5,526 4,140 1,386 4.8% 3.1 23,241 891.3 463.26 2003
5,644 4,263 1,381 4.9% 3.1 25,119 934.7 463.33 2004
5,779 4,518 1,261 3.6% 3.0 26,967 968.6 463.36 2005
8,197 6,562 1,635 2.9% 3.0 28,812 997.0 463.32 2006
10,129 8,041 2,088 2.9% 2.9 30,825 1,025.4 463.33 2007
12,453 9,892 2,561 3.1% 2.9 32,630 1,057.7 463.28 2008
12,643 9,973 2,670 3.1% 2.9 34,560 1,090.2 463.28 2009
13,968 11,044 2,924 2.4% 2.8 36,178 1,116.7 463.25 2010
16,115 12,936 3,179 1.1% 2.8 37,543 1,130.4 462.81 2011
15,470 12,318 3,152 1.1% 2.8 39,588 1,142.4 462.81 2012
16,132 12,833 3,299 1.8% 2.7 41,790 1,161.5 463.36 2013
17,732 14,020 3,712 1.3% 2.7 43,802 1,176.1 463.36 2014
18,522 14,400 4,122 1.7% 2.7 45,986 1,181.4 463.36 2015
18,432 14,087 4,345 0.1% 2.6 47,975 1,182.4 463.36 2016
18,626 13,822 4,804 0.5% 2.6 51,219 1,188.6 463.36 2017
18,688 13,625 5,063 0.3% 2.6 51,219 1,191.9 463.43 2018
Note : 1) Figures and prior to 1991 are the results from population survey figures after 1992 source : Smart City Officer
are the results from resident registration data (Including foreigners)
2) Foreign households excluded (since1998)