
Page 141 - 2020년김해시통계연보
P. 141
Agriculture, Forestry and Fishing 139
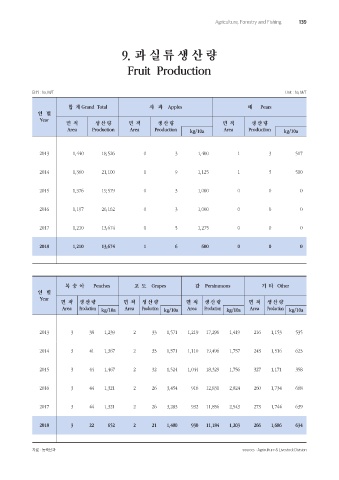
9. 과 실 류 생 산 량
Fruit Production
단위 : ha, M/T Unit : ha, M/T
합 계 Grand Total 사 과 Apples 배 Pears
연 별
Year
면 적 생 산 량 면 적 생 산 량 면 적 생 산 량
Area Production Area Production kg/10a Area Production kg/10a
2013 1,440 18,526 0 3 1,400 1 3 517
2014 1,360 21,100 1 9 1,125 1 5 500
2015 1,376 19,579 0 3 1,000 0 0 0
2016 1,197 26,162 0 3 1,000 0 0 0
2017 1,210 13,674 0 5 1,275 0 0 0
2018 1,210 13,674 1 6 600 0 0 0
복 숭 아 Peaches 포 도 Grapes 감 Persimmons 기 타 Other
연 별
Year
면 적 생 산 량 면 적 생 산 량 면 적 생 산 량 면 적 생 산 량
Area Production kg/10a Area Production kg/10a Area Production kg/10a Area Production kg/10a
2013 3 38 1,239 2 33 1,571 1,219 17,296 1,419 216 1,153 535
2014 3 41 1,367 2 33 1,571 1,110 19,496 1,757 243 1,516 623
2015 3 44 1,467 2 32 1,524 1,044 18,329 1,756 327 1,171 358
2016 3 44 1,321 2 26 3,454 916 12,831 2,824 260 1,734 668
2017 3 44 1,321 2 26 3,283 932 11,856 2,543 273 1,744 639
2018 3 22 652 2 21 1,400 930 11,184 1,203 266 1,686 634
자료 : 농축산과 sources : Agriculture & Livestock Division