Page 137 - 2020년김해시통계연보
P. 137

Agriculture, Forestry and Fishing              135


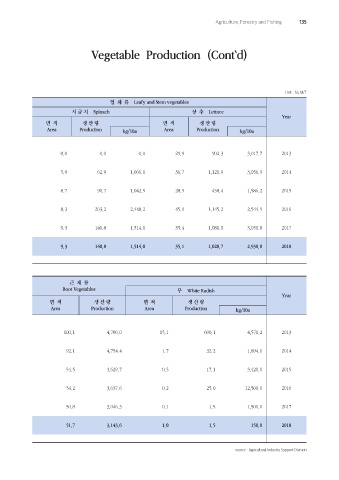
                                 Vegetable  Production  (Cont`d)


                                                                                                     Unit : ha, M/T
                                        엽  채  류    Leafy and Stem vegetables
                          시 금 치    Spinach                          상  추    Lettuce
                                                                                                    Year
                 면  적         생 산 량                       면  적         생 산 량
                 Area        Production     kg/10a         Area       Production     kg/10a


                      0.0           0.0           0.0          29.9        902.3        3,017.7     2013


                      5.9          62.9        1,066.1         36.7       1,121.9       3,056.9     2014


                      8.7          90.7        1,042.5         28.9        458.4        1,586.2     2015


                      8.3         203.2        2,448.2         45.0       1,145.2       2,544.9     2016


                      9.3         140.8        1,514.0         35.4       1,080.0       3,050.8     2017


                      9.3         140.8        1,514.0         35.1       1,028.7       2,930.8     2018


                         근  채  류
                       Root Vegetables                         무    White Radish
                                                                                                    Year
                  면  적            생 산 량            면  적            생 산 량
                   Area          Production         Area          Production        kg/10a


                       100.1           4,700.0           15.1            690.1          4,570.2     2013


                        92.1           4,754.4            1.7             32.2          1,894.1     2014


                        54.5           3,629.7            0.5             17.1          3,420.0     2015


                        54.2           3,637.6            0.2             25.0         12,500.0     2016


                        50.8           3,046.3            0.1             1.5           1,500.0     2017


                        51.7           3,143.6            1.0             1.5            150.0      2018


                                                                                    source : Agricultural Industry Support Division
   132   133   134   135   136   137   138   139   140   141   142