Page 135 - 2020년김해시통계연보
P. 135

Agriculture, Forestry and Fishing              133


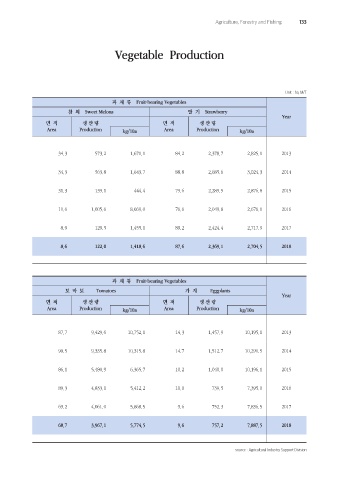
                                         Vegetable  Production


                                                                                                     Unit : ha, M/T
                                        과  채  류    Fruit-bearing Vegetables
                         참  외    Sweet Melons                      딸  기    Strawberry
                                                                                                    Year
                 면  적         생 산 량                       면  적         생 산 량
                 Area        Production     kg/10a         Area       Production     kg/10a


                      34.3        573.2        1,671.1         84.2       2,378.7       2,825.1     2013


                      34.3        563.8        1,643.7         88.8       2,685.6       3,024.3     2014


                      31.3        139.1         444.4          79.6       2,289.9       2,876.8     2015


                      11.6       1,005.6       8,669.0         76.6       2,049.8       2,676.0     2016


                      8.9         129.5        1,455.1         89.2       2,424.4       2,717.9     2017


                      8.6         122.0        1,418.6         87.6       2,369.1       2,704.5     2018


                                        과  채  류    Fruit-bearing Vegetables
                        토  마  토         Tomatoes                  가  지          Eggplants
                                                                                                    Year
                 면  적         생 산 량                       면  적         생 산 량
                 Area        Production     kg/10a         Area       Production     kg/10a


                      87.7       9,429.6      10,752.1         14.3       1,457.9      10,195.1     2013


                      90.5       9,335.8      10,315.8         14.7       1,512.7      10,290.5     2014


                      86.1       5,480.9       6,365.7         10.2       1,040.0      10,196.1     2015


                      89.3       4,833.1       5,412.2         10.0        739.5        7,395.0     2016


                      69.2       4,061.0       5,868.5         9.6         752.3        7,836.5     2017


                      68.7       3,967.1       5,774.5         9.6         757.2        7,887.5     2018


                                                                                    source : Agricultural Industry Support Division
   130   131   132   133   134   135   136   137   138   139   140