
Page 7 - N. Metabolism and metabolic diseases
P. 7
Intravital imaging of dynamic hepatic microenvironment during the progression of NAFLD
inMCDdiet-inducedNAFLDmousemodel
1
1
Jieun Moon , Eunji Kong , and Pilhan Kim 1*
1 KI for Health Science and Technology (KIHST), Korea Advanced Institute of Science and Technology (KAIST), 291 Daehak-ro, Yuseong-gu, Daejeon, 34141,
Republic of Korea
BACKGROUND AIM
Nonalcoholic fatty liver disease (NAFLD) is a rapidly increasing chronic To clarify dynamic and complex cellular mechanisms in
liver disorder across the globe. NAFLD progresses to steatosis, NASH, NAFLD progression, a longitudinal intravital visualization of
cirrhosis, and ultimately cancer. Whereas steatosis is considered as hepatic microenvironment is highly desirable.
reversible, NASH has significantly increased risk to lead to severe stages Our intravital visualization approach has an advantage over
such as cirrhosis and cancer. However, effective treatment strategy of conventional approach based on histology as we can
NASH has remained elusive and improved understanding of underlying directly observe dynamic spatial and temporal changes in
mechanism in transition from steatosis to NASH is highly needed. By analyzing with conventional histology of living mouse. Thus, in this study, we visualized intravitally
exposed liver tissue, many studies to identify unknown pathological mechanisms in NAFLD progression have been dynamic events in hepatic microenvironment in different
actively conducted. Yet, these studies are very difficult to analyze the dynamically varying pathological phenotypes stages of NAFLD progression in living MCD diet-induced
in various stages of NAFLD progression as it can observe at only one time-point at a time from a single animal model. NAFLD mouse model.
METHODS
I. Intravitalreal-time imaging system II. MCD diet-induced NAFLD mouse model III. Preparation for intravital liver imaging
Beam Scanner Imaging Optics
Excitation Laser Beam Scanner Imaging Optics Methionine and choline-deficient (MCD) After the anesthetization, the left lobe
Excitation Laser
Polygon MCD diet
Laser diet is one of the most widely used diet of liver was exposed by laparotomy
640 • Full Custom-Built
Laser • Video-rate to induce NAFLD. Methionine and and positioned on a wet gauze to
561 choline have a pivotal role of β-oxidation minimize motion by separating other
Laser (30fps, 512x512 pixels)
488 in lipid metabolism in liver. When the tissues. Using customized heater and
Signal Detection • Multi-color imaging
Signal Detection
• Sub-µm resolution fat, the influx of excessive fat into liver of both exposed liver tissue and body
PMT mice was fed MCD diet contained high commercial heating pad, temperature
PMT
• Real-time acquisition & was overwhelmed. Yet, the lipid metabolism to secrete or degrade was maintained at 36°C during in vivo
PMT dysfunctions due to lack of methionine and choline. As the result, imaging.
recording
DBS (dichroic beam splitter), BPF (band pass filter), M the liver of mice fed with MCD diet was induced steatosis and To prevent the exposed liver tissue from being dry, warmed saline was
(mirror), L (lens), ND (neutral density filter) for laser
power control steatohepatitis. continuouslysuppliedduringinvivoimaging.
RESULTS
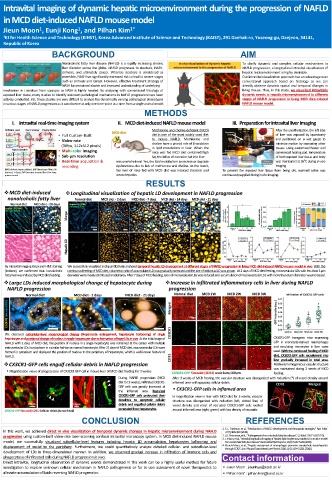
MCD diet-induced Longitudinal visualization of hepatic LD development in NAFLD progression
nonalcoholic fatty liver Normal diet MCD diet - 2 days MCD diet - 7 days MCD diet - 14 days MCD diet - 21 days
Normal diet MCD diet - 28 days Hepatic LD (SF44)
Hepatic LD (SF44) Sinusoid (CD31)
Sinusoid (CD31)
Merge
20µm
50µm
Hepatic LD
50µm
By intravital imaging (top) and H&E staining We successfully visualized and quantitatively analyzed temporal hepatic LD development at different stages of NAFLD progression in living MCD diet-induced NAFLDmouse model in vivo. With the
(bottom), we confirmed that nonalcoholic continuousfeedingofMCDdiet,volumetricratioofaccumulatedLDwasgraduallyincreasedandthesizeofindividualLDwasgrown. At2daysofMCDdietfeeding,microvesicularLDswithlessthan3µm
fattyliverwasinducedbyMCDdietfeeding. diameterweremainlydistributedintotalarea.After7daysofMCDfeeding,ratioofmicrovesicularLDswasreducedand accumulationofmacrovesicularLDswithmorethan9µmdiameterwasincreased.
Large LDs induced morphological change of hepatocyte during Increase in infiltrated inflammatory cells in liver during NAFLD
NAFLD progression progression
Normal diet MCD diet - 2 days * MCD diet - 21 days Normal diet MCD 1W MCD 2W MCD 3W
LD (SF44) Sinusoid (CD31) * * * * * Merged 100μm
10µm
We observed subcellular-level morphological change (Hepatocyte enlargement, hepatocyte ballooning) of single CX3CR1
hepatocyteandpositionalchangeofnucleusinsinglehepatocyteduetoformationoflargeLDsinvivo.Attheinitialstageof CX3CR1-GFP transgenic mice expressing
NAFLD with 2 days of MCD diet, the position of nucleus in a single hepatocyte was remained at the center with multiple GFP in monocyte-derived macrophages
microvesicularLDsincytoplasminasimilarfashionasnormalhepatocyte.After21daysofMCDdiet,macrovesicularLDswere * * and circulating monocytes in liver were
formed in cytoplasm and displayed the position of nucleus to the periphery of hepatocyte, which is well-known feature of used.WiththecontinuedfeedingofMCD
NAFLD. CD31 * * diet, CX3CR1-GFP cells recruitment into
CX3CR1-GFP cells engulf cellular debris in NAFLD progression * * * liver gradually increased in total area.
Relativelyhomogeneousvascularstructure
Magnification views of phagocytosis of CX3CR1 GFP cell in mouse liver of MCD diet feeding for 3 weeks CX3CR1-GFP Sinusoid (CD31) scale bars;100µm was maintained during 2 weeks of MCD
feeding.
During NAFLD progression (MCD After 3 weeks of MCD feeding, the vascular structure was disorganized with reduction (*) of vessel density around
dietfor3weeks),infiltratedCX3CR1- inflamed area withapoptotic cellular debris. CD31 Merged
GFP cells was greatly increased at CX3CR1-GFP cells in inflamed area
the inflamed area. Recruited
CX3CR1-GFP cells protruded their In magnification view in liver with MCD diet for 3 weeks, vascular
dendrites to apoptotic cellular structure was disorganized with reduction (left, dotted line) of
10µm 10µm debris and engulfed cellular debris vessel density and most of recruited CX3CR1-GFP cells existed
generatedfromhepatocytes.
CX3CR1-GFP Sinusoid (CD31) Cellular debris (Arrow head) around inflamed area (right, green) with lowdensity of sinusoids.
CONCLUSION REFERENCES
1. S. L. Friedman,et al., “Mechanisms ofNAFLD developmentand therapeutic strategies,” Nat. Med.
In this work, we achieved direct in vivo visualization of temporal dynamic changes in hepatic microenvironment during NAFLD 24(7),908–922(2018).
progression using custom-built video-rate laser-scanning confocal intravital microscopy system. In MCD diet-induced NAFLD mouse 2. J.K.Downman,etal.,“Pathogenesisofnon-alcoholicfattyliverdisease”,QJMed.103:71-83(2010).
3. J.Moon,etal.,"Intravitallongitudinalimagingofhepaticlipiddropletaccumulationinamurinemodel
model, we successfully visualized subcellular-level features including hepatic LD accumulation, hepatocytes ballooning and fornonalcoholicfattyliverdisease”BiomedicalOpticExpress,11(9):5132-5146(2020).
displacement of nuclei to the periphery. Furthermore, we could quantitatively analyze detailed cellular- and subcellular-level 4. Kouichi Miura, et al., “Hepatic recruitment of macrophages promotes nonalcoholic steatohepatitis
throughCCR2”,AmJPhysiolGastrointestLiverPhysiol.302(11):G1310–G1321(2012).
development of LDs in three-dimensional manner. In addition, we observed gradual increase in infiltration of immune cells and
phagocytosisofinfiltratedcellsduringNAFLDprogressionin vivo. Contact information
Direct intravital, longitudinal observation of dynamic events demonstrated in this work can be a highly useful method for future
investigation to explore unknown cellular mechanism in NAFLD pathogenesis or for in vivo assessment of novel therapeutics to Jieun Moon : jieunhye@kaist.ac.kr
alleviateaccumulationoflipidsreversingNAFLDprogression. Pilhan Kim* : pilhan.kim@kaist.ac.kr