
Page 3 - N. Metabolism and metabolic diseases
P. 3
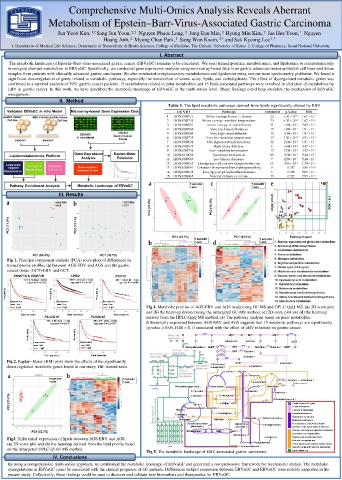
Comprehensive Multi-Omics Analysis Reveals Aberrant
                  Metabolism of Epstein–Barr-Virus-Associated Gastric Carcinoma

                                                                              2
                                                                  2
                                                                                                         1
                                                                                             2
                     Jun Yeob Kim, 1,†  Sang Jun Yoon, 2,†  Nguyen Phuoc Long, Jung Eun Min, Hyung Min Kim, Jae Hee Yoon, Nguyen
                                     Hoang Anh, Myung Chan Park, Sung Won Kwon,  2,*  and Suk Kyeong Lee  1,*
                                                              1
                                              2
     1. Department of Medical Life Sciences, Department of Biomedicine & Health Sciences, College of Medicine, The Catholic University of Korea  2. College of Pharmacy, Seoul National University
                                                         I. Abstract
    The metabolic landscape of Epstein–Barr-virus-associated gastric cancer (EBVaGC) remains to be elucidated. We used transcriptomics, metabolomics, and lipidomics to comprehensively
    investigate aberrant metabolism in EBVaGC. Specifically, we conducted gene expression analyses using microarray-based data from gastric adenocarcinoma epithelial cell lines and tissue
    samples from patients with clinically advanced gastric carcinoma. We also conducted complementary metabolomics and lipidomics using various mass spectrometry platforms. We found a
    significant downregulation of genes related to metabolic pathways, especially the metabolism of amino acids, lipids, and carbohydrates. The effect of dysregulated metabolic genes was
    confirmed in a survival analysis of 3951 gastric cancer patients. 15 metabolisms related to polar metabolites and 15 lipid-associated pathways were involved in alteration of metabolites by
    EBV in gastric cancer. In this work, we have described the metabolic landscape of EBVaGC at the multi-omics level. These findings could help elucidate the mechanism of EBVaGC
    oncogenesis.
                      II.  Method
                                                            Table 1. The lipid metabolic pathways derived from lipids significantly altered by EBV.


                      III. Results


   Fig 1. Principal component analysis (PCA) score plots of differences in
   transcriptome profiles (a) between AGS-EBV and AGS and (b) gastric
   cancer tissue (GCT)-EBV and GCT.


                                                    Fig 4. Metabolic profiles of AGS-EBV and AGS made using GC-MS and HPLC-QqQ MS. (a) 2D score plot
                                                    and (b) the heatmap derived using the untargeted GC-MS method. (c) 2D score plot and (d) the heatmap
                                                    derived from the HPLC-QqQ MS method. (e) The pathway analysis based on polar metabolites
                                                    differentially expressed between AGS-EBV and AGS suggests that 15 metabolic pathways are significantly
                                                    (p-value < 0.05, FDR < 0.1) associated with the effect of EBV infection on gastric cancer.


   Fig 2. Kaplan–Meier (KM) plots show the effects of the significantly
   down-regulated metabolic genes found in our study. HR: hazard ratio.


    Fig3. Differential expression of lipids between AGS-EBV and AGS.
    (a) 2D score plot and (b) the heatmap derived from the lipid profile based
    on the untargeted UPLC-QToF MS method.
                                                    Fig 5. The metabolic landscape of EBV-associated gastric carcinoma.
                   IV. Conclusions
    By using a comprehensive multi-omics approach, we established the metabolic landscape of EBVaGC and generated a comprehensive framework for mechanistic studies. The metabolic
    dysregulations in EBVaGC could be associated with the clinical prognosis of GC patients. Differences in lipid expression between EBVaGC and EBVnGC were notably supported in the
    present study. Collectively, these findings could be used to discover and validate new biomarkers and therapeutics for EBVaGC.