
Page 59 - I. Chemical biology and drug discovery
P. 59
The root bark of MA induces p53-independent apoptosis
in HCT116 human colorectal carcinoma cells
Hyun-Ji Park and Shin-Hyung Park 1*
1
1 Department of Pathology, College of Korean Medicine, Dong-eui University, Busan, 47227, Korea.
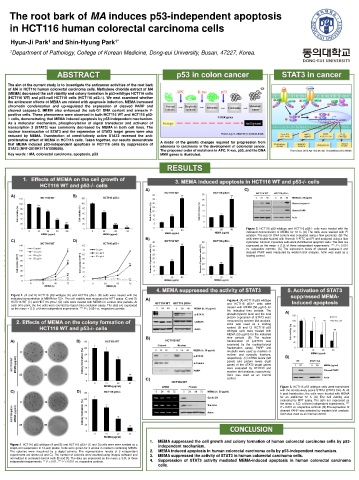
The aim of the current study is to investigate the anticancer activities of the root bark
of MA in HCT116 human colorectal carcinoma cells. Methylene chloride extract of MA
(MEMA) decreased the cell viability and colony formation in p53-wildtype HCT116 cells
(HCT116 WT) and p53-null HCT116 cells (HCT116 p53-/-). We next examined whether
the anticancer effects of MEMA are related with apoptosis induction. MEMA increased
chromatin condensation and up-regulated the expression of cleaved PARP and
cleaved caspase-3. MEMA also enhanced the sub-G1 DNA content and annexin V-
positive cells. These phenomena were observed in both HCT116 WT and HCT116 p53-
/- cells, demonstrating that MEMA induced apoptosis by p53-independent mechanism.
As a molecular mechanism, phosphorylation of signal transducer and activator of
transcription 3 (STAT3) was commonly decreased by MEMA in both cell lines. The
nuclear translocation of STAT3 and the expression of STAT3 target genes were also
reduced by MEMA. Transfection of constitutively active STAT3 reversed the anti- PNAS July 9, 2002 99 (14) 9433-9438
proliferative effect of MEMA in HCT116 cells. Taken together, our results demonstrate A model of the genetic changes required for progression from
that MEMA induced p53-independent apoptosis in HCT116 cells by suppression of adenoma to carcinoma in the development of colorectal cancer.
STAT3 (NRF-2019R1F1A1059588). The proposed order of mutations in APC, K-ras, p53, and the DNA Front Oncol. 2012 Apr 10;2:30. doi: 10.3389/fonc.2012.00030.
Key words : MA, colorectal carcinoma, apoptosis, p53 MMR genes is illustrated.
Figure 3. HCT116 p53 wildtype and HCT116 p53-/- cells were treated with the
indicated concentration of MEMA for 72 h. (A) The cells were stained with PI
solution. The sub-G1 DNA content was evaluated using a flow cytometer. (B) The
cells were double-stained with Annexin V-FITC and PI and analyzed using a flow
cytometer. Annexin V-positive cells were identified as apoptotic cells. The data are
expressed as the mean ± S.D. of three independent experiments. *** P < 0.001
vs. respective controls. (C) The expression levels of cleaved caspase-3 and
cleaved PARP were measured by western blot analysis. Actin was used as a
loading control.
Figure 1. (A and B) HCT116 p53 wildtype (A) and HCT116 p53-/- (B) cells were treated with the
indicated concentration of MEMA for 72 h. The cell viability was measured by MTT assay. (C and D)
HCT116 WT (C) and HCT116 p53-/- (D) cells were treated with MEMA for various time periods. At Figure 4. (A) HCT116 p53 wildtype
each time point, the live cells were counted by trypan blue exclusion assay. The data are expressed and HCT116 p53-/- cells were
as the mean ± S.D. of three independent experiments. *** P < 0.001 vs. respective controls. treated with MEMA (50 μg/ml) for
the indicated time periods. The
phosphorylation level and the total
protein expression of STAT3 were
measured by western blot analysis.
Actin was used as a loading
control. (B and C) HCT116 p53
wildtype cells were treated with
MEMA (50 μg/ml) for the indicated
time periods. (B) The nuclear
translocation of p-STAT3 was
examined by the nuclear/cytosol
fractionation assay. PARP and
α-tubulin were used as markers of
nuclear and cytosolic fractions,
respectively. (C) mRNA levels (left
panel) and protein levels (right
panel) of the STAT3 target genes
were evaluated by RT-PCR and
western blot analysis, respectively.
Actin was used as an internal
control.
Figure 5. HCT116 p53 wildtype cells were transfected
with the constitutively active STAT3 (STAT3 CA). At 48
h post-transfection, the cells were treated with MEMA
for an additional 72 h. (A) The cell viability was
evaluated by MTT assay. The data are expressed as
the mean ± S.D. of three independent experiments. ***
P < 0.001 vs. respective controls. (B) The expression of
cleaved PARP was detected by western blot analysis.
Actin was used as an internal control.
1. MEMA suppressed the cell growth and colony formation of human colorectal carcinoma cells by p53-
Figure 2. HCT116 p53 wildtype (A and B) and HCT116 p53-/- (C and D) cells were were seeded as a independent mechanism.
single-cell suspension in 12-well plates. Cells were grown for 2 weeks in medium containing MEMA.
The colonies were visualized by a digital camera. The representative results of 3 independent 2. MEMA induced apoptosis in human colorectal carcinoma cells by p53-independent mechanism.
experiments are shown (A and C). The number of colonies were counted using ImageJ software and 3. MEMA suppressed the activity of STAT3 in human colorectal carcinoma cells.
normalized to untreated control cells (B and D). The data are expressed as the mean ± S.D. of three
independent experiments. ** P < 0.01, *** P < 0.001 vs. respective controls. 4. Suppression of STAT3 activity mediated MEMA-induced apoptosis in human colorectal carcinoma
cells.