
Page 161 - D. Cancer biology
P. 161
Identification of a novel compound that inhibits cancer metastasis
through regulation of the Akt signaling pathway and Twist1
Haelim Yoon¹, Jain Ha¹, Junho Lee¹ and Sayeon Cho¹
Laboratory of Molecular and Pharmacological Cell Biology, College of Pharmacy, Chung-Ang University, Seoul 06974, Republic of
Korea.
Abstract Introduction
The process of spreading cancer cells to other body parts is called Liver cancer is the seventh most commonly diagnosed cancer and the third leading cause of death
metastasis, which is the major cause of cancer deaths. Since it is difficult from cancer worldwide in 2018. The primary cancer develops the potential to escape from the
to remove cancer cells once they spread out, suppressing cancer primary site to other parts of the body and eventually develops into secondary cancers. In recent
metastasis is a major challenge in conquering cancer. In this study, we years, several metastasis-related transcription factors have been reported. As a transcription factor,
investigated a chemical that had anti-cancer effects as a way to prevent Twist1 regulates the expression of various genes, such as E-cadherin and N-cadherin, that are
the metastatic activity of human liver cancer cell line, SK-Hep1. The associated with the progression of cancer. It has been reported that high expression of Twist1 is
compound 3-acetyl-5,8-dichloro-2-((2,4-dichlorophenyl)amino)quinolin- associated with aggressive cancers such as breast cancer, gastric cancer, pancreatic cancer, and
4(1H)-one (ADQ) showed significant anti-cancer effects, including liver cancer. Therefore, the regulatory mechanism of Twist1 needs to be researched to identify
suppression of wound healing and cellular invasion. Furthermore, cellular proper therapeutic strategies. In addition, The Akt pathway has been implicated in various cancer
growth and multicellular tumor spheroid survival/invasion of SK-Hep1 cells types, including prostate cancer, gastric cancer, and liver cancer. Akt is often found highly
were significantly inhibited by ADQ. The anti-metastatic effect and anti- phosphorylated in most liver cancer cell lines and also in liver cancer tissues from patients.
proliferative effect of ADQ were mediated by inhibition of the AKT signaling Therefore, the proper regulation of the Akt pathway is one of the crucial goals for anti-cancer
pathway and downregulation of Twist1 protein levels. Therefore, these strategies. In this study, confirm the anti-cancer effect of a chemical, 3-acetyl-5,8-dichloro-2-((2,4-
findings suggest that the ADQ may be an efficient candidate for cancer dichlorophenyl)amino)quinolin-4(1H)-one (ADQ), on a liver cancer cell line, and investigated of its
drug development. mechanism.
Results
A C D
ADQ (μM) 0 2 5
A SK-Hep1 B SK-Hep1 Figure 1. Cell viability was not p-Akt ADQ (μM) 0 2 5 80 c 100 G2/M S G0/G1
(10% serum) (1% serum) significantly affected by ADQ CDKN1A 70 c ADQ (0 μM)
Fold
Akt
120 24 h 120 24 h treatment. SK-Hep1 cells were α-tubulin CDKN1B 1.0 1.8 2.4 50 ADQ (2 μM) 80
48 h
48 h
treated with ADQ at the indicated
100
ADQ (5 μM)
100
Fold
Cell viability (%) 80 80 culture medium containing (A) 10% FBS B 200 c CDKN2B 1.0 1.1 1.5 Cell population (%) 60 40 30 Cell population (%) 60 40
1.6
1.0
2.1
concentrations for 24 or 48 h in cell
Fold
60
or (B) 1% FBS. Cell viability was
60
CDKN2D
observed using the EZ-Cytox solution.
40
40
The relative cell viability is shown as bar
150
Fold
20
(100%). Data are representative of three
0 20 0 graphs compared to the untreated group Relative SOD promoter activity (%) 100 GAPDH 1.0 1.3 2.1 20 10 a 20
- 1 2 5 10 20 40 - 1 2 5 10 20 40 experiments and expressed as the 50
means ± SEM (n = 3). 0 G0/G1 S G2/M 0
2
ADQ (µM) 0 0 2 5 0 ADQ (µM) 5
A ADQ (μM)
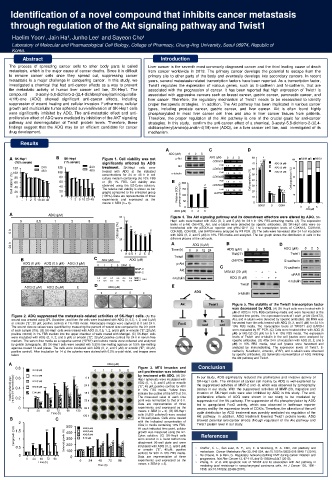
60 Figure 4. The Akt signaling pathway and its downstream effectors were altered by ADQ. SK-
0 0.5 1 2 5 E Hep1 cells were treated with ADQ (0, 2, and 5 μM) for 24 h in 10% FBS-containing media. (A) The expression
Closure (%) 40 a c transfected with the pSOD-Luc reporter and gWIZ-GFP. (C) The transcription levels of CDKN1A, CDKN1B,
levels of p-Akt (Ser473), Akt, and α-tubulin were detected by specific antibodies. (B) SK-Hep1 cells were co-
0 h c c c CDKN2B, CDKN2D, and GAPDH were analyzed by RT-PCR. (D) The cells were harvested after 24 h of incubation
with ADQ (0, 2, and 5 μM) in 10% FBS media and analyzed. The bar graph shows the distribution of cells in the
20 different phases of the cell cycle.
24 h A ADQ (5 μM) B D ADQ (μM) 0 2 5
0 Time (h) 0 6 12 24 ADQ (μM) 0 2 5
0 0.5 1 2 5 E Twist1 TWIST1 Twist1
B C ADQ (μM) ADQ (μM) GAPDH E-cadherin
ADQ (0 μM) ADQ (0.5 μM) ADQ (1 μM) p-Akt
0 1 2 5 SFM E C N-cadherin
MMP-9 Akt
MMP-2 MG132 (20 μM) - + - +
uPAR
1.0 0.7 0.7 0.5 0.0 0.6 MMP-9 Fold α-tubulin ADQ (5 μM) - - + +
1.0 0.6 0.3 0.1 0.1 0.3 MMP-2 α-tubulin
D Twist1
ADQ (2 μM) ADQ (5 μM) E ADQ (μM) E
0 2 5 E ADQ α-tubulin
Akt Twist1 Figure 5. The stability of the Twist1 transcription factor
was decreased by ADQ. (A) SK-Hep1 cells were treated with 5
μM of ADQ in 10% FBS-containing media and were harvested at the
Figure 2. ADQ suppressed the metastasis-related activities of SK-Hep1 cells. (A) The indicated time points. The expression levels of Twist1, p-Akt (Ser473),
wound was created using SPL Scratcher, and then the cells were incubated with ADQ (0, 0.5, 1, 2, and 5 μM) N- E- Akt, and α-tubulin were detected by specific antibodies. (B) RNA was
or emodin (“E”; 20 μM; positive control) in 1% FBS media. Microscopic images were captured at 0 and 24 h. FoxO cad cad harvested from the cells treated with ADQ (0, 2, and 5 μM) for 24 h in
The wound closure values were quantified by measuring the percent of wound size compared to the 0 h point 10% FBS media. The transcription levels of TWIST1 and GAPDH
of each sample (0%). (B) SK-Hep1 cells were treated with ADQ (0, 0.5, 1, 2, and 5 μM) or emodin (“E”; 20 μM; were evaluated by RT-PCR. (C) Cells were treated either with ADQ (5
positive control) in 1% FBS medium into the upper chamber of wells coated with Matrigel. (C) SK-Hep1 cells μM) or MG132 (20 μM) for 6 h in 10% FBS media. The expression
were incubated with ADQ (0, 1, 2, and 5 μM) or emodin (“E”; 20 μM; positive control) for 24 h in serum-free levels of Twist1 and α-tubulin in the cell lysates were analyzed by
medium. The serum-free media as a negative control (“SFM”) and culture media were collected and analyzed specific antibodies. (D) After 24 h of incubation with ADQ (0, 2, and 5
by gelatin zymography. (D) SK-Hep1 cells were seeded with 0.35% low-melting agarose on 0.5% low-melting Proliferation EMT μM) in 10% FBS media, total cell lysates were harvested and
agarose-coated 12-well plates. The cells were incubated with ADQ (0, 2, and 5 μM) or emodin (“E”; 40 μM; analyzed by immunoblotting. The expression levels of Twist1, E-
positive control). After incubation for 14 d, the colonies were stained with 0.5% crystal violet, and images were cadherin, N-cadherin, vimentin, uPAR, and α-tubulin were observed
taken. by specific antibodies. (E) Schematic representation of ADQ inhibiting
the Akt pathway and Twist1.
A ADQ (μM)
0.8 Figure 3. MTS invasion and Conclusion
ADQ (0 μM) 0 1 2 5 E
cell proliferation was inhibited In our study, ADQ significantly reduced the proliferative and invasive activity of
by treatment with ADQ. (A) SK-
ADQ (1 μM)
0 h
Invaded spheroid area (ratio to 0 h spheroid size) 0.4 ADQ (2 μM) a a c c a c c 24 h ADQ (0, 1, 2, and 5 μM) or emodin SK-Hep1 cells. The inhibition of cancer cell motility by ADQ is well-explained by
0.6
Hep1 spheroids were incubated with
the suppressed activities of MMP-2 and -9, which was observed by zymography
(“E”; 40 μM; positive control) for 48 h
ADQ (5 μM)
assays in our study. With the suppressed activities of MMP-2/9, migration and
in 10% FBS media. Yellow lines
invasion of SK-Hep1 cells were also inhibited by ADQ in this study. The anti-
E (40 μM)
48 h
indicate the outline of the MTS at 0 h.
The measured value of each time
0.2
point was normalized to that of 0 h.
72 h
suppression of the Akt pathway. The suppression of Akt phosphorylation by ADQ
Data are representative of three proliferative effects of ADQ were shown in our study to be mediated by
led to upregulated FoxO activity, which was observed in luciferase reporter
0 0 24 48 72 96 120 96 h experiments and expressed as the assays and by the expression levels of CDKIs. Therefore, the alteration of the cell
means ± SEM (n = 3). (B) SK-Hep1
1 2 3 Time (h) 5 6 120 h cells (1,500 cells/well) were seeded cycle distribution by ADQ treatment was possibly mediated via regulation of the
4
B C 500 μm in 96-well plates. Cells were treated Akt pathway. in addition, ADQ treatment lowered Twist1 protein levels. ADQ
showed potential anti-cancer effects through regulation of the Akt pathway and
2 500 ADQ (0 μM) with the indicated concentration of Twist1 protein level in our study.
ADQ in media containing 10% FBS.
Cell growth (O.D) 1.5 1 Spheroid growth (%) 400 ADQ (2 μM) a a c growth was measured using the Ez- References
At each indicated time point, cellular
ADQ (5 μM)
Cytox solution. (C) SK-Hep1 cells
300
E (40 μM)
were seeded in a round bottom low
incubated with ADQ (0, 2, and 5 μM)
0.5 200 c c c c attachment 96-well plate and were • Chaffer, C. L., San Juan, B. P., Lim, E. & Weinberg, R. A. EMT, cell plasticity and
or emodin (“E”; 40 μM; positive
100
0 0 control) for 96h in 10% FBS media. • metastasis. Cancer Metastasis Rev 35, 645-654, doi:10.1007/s10555-016-9648-7 (2016).
De Craene, B. & Berx, G. Regulatory networks defining EMT during cancer initiation and
Data are representative of three
0 24 48 72 96 experiments and expressed as the progression. Nat Rev Cancer 13, 97-110, doi:10.1038/nrc3447 (2013).
1 2 3 4 5 0 24 48 72 96 • Zhang, X. et al. Anti-apoptotic role of TWIST and its association with Akt pathway in
Time (h)
Time (h) means ± SEM (n = 3). mediating taxol resistance in nasopharyngeal carcinoma cells. Int J Cancer 120, 1891-
1898, doi:10.1002/ijc.22489 (2007).