
Page 15 - X. Stem cell biology
P. 15
Identification of novel cell surface markers on spermatogonia stem cells
2#
1#
Jee Seung Kim , Jin Seop An , Hyun Min Lee , Beom Jin Shin , Buom Yong Ryu *, and Chun Jeih Ryu *
1
2
1
2
1 Department of Integrative Bioscience and Biotechnology, Sejong University, Seoul, South Korea
2 Department of Animal Science and Technology, Chung-Ang University, Ansung, Gyeonggi-Do, South Korea
# Two authors contributed equally to this work
BACKGROUND AIM
Spermatogonial stem cells (SSCs) are specialized stem cells that maintain sperm Male infertility became not only the major barrier for pregnancy but a side effect of anti-
production throughout the reproduction life of male mammals. SSCs are considered as the cancer therapy. Transplantation of SSCs has emerged as a promising treatment for male
fundamental key factor for spermatogenesis. Since the SSCs are very rare [1], identifying infertility as many stem cell-based therapy developed [5]. However, rare population and
the specific markers is crucial for further researches. Though several surface proteins lack of specific markers of SSCs limit the effort for increasing therapeutic efficiency.
such as GFR-a1 [2], CD49f [3], and Thy-1.2 [4] are suggested as SSCs markers, their Identifying specific and reliable markers of SSCs should be a priority for the advanced
specificity or expression are only partial. The sorting of SSCs is critical for the therapeutic application of SSCs, especially therapeutic usage. Hence, we investigated new SSC
application of male infertility, but there are no reliable SSC surface markers. markers that show the specificity of SSCs.
METHODS
5
Cell culture: 2.0x10 GCES were seeded per well of 24-well culture plates containing mitotically inactivated STO feeder cells. Cultures were maintained in ɑ-MEM based mouse serum-
free medium containing GDNF, GFRa1, and basic fibroblast growth factor. Cell cultures were passaged every 7 days and medium was replaced every 2–3 days.
Primary SSC isolation: Cells were obtained from the 6 to 8 days old C57BL/6J mice using percoll.
Flow cytometry analysis: Obtained cells were stained with antibodies and analyzed by BD FACScalibur.
qRT-PCR: Isolated RNAs were synthesized into cDNA and analyzed with SYBR Green fluorescence.
ICC: GCES seeded on the mitotically inactivated STO feeder cells coated coverslip were fixed with 2% PFA and stained with antibodies. Imaging was performed with Leica TCS SP5.
RESULTS
Since GCES were cultured on the STO feeder cells, we screened both A A
GFP positive cultured germ cell enriched for SSC (GCES) lines and
STO feeder cells with 255 antibodies. We identified eight candidates
as new surface markers for SSCs, which CD24, CD71, CD98, CD147,
Plexin B2 (PLXNB2), Podoplanin (PDPN), E1B-AP5, and 57-C11, a
house antibody against E1B-AP5 (Table. 1, Fig 2A). Before we got
into further study, we first characterized the GCES to distinguish from B
the STO cells. We compared the RNA expression level of SSCs
markers, GFR-a1, PLZF, OCT4, and DAZL between two cells to
confirm their different characteristics. STO cells showed either low
(GFR-a1) or non-detected (PLZF, OCT4, DAZL) expression levels
relative to GCES (Fig. 1A). We did flow cytometry analysis of GCES
with various known SSCs markers (Fig. 1B). Expression of GFR-a1
and CD49f on GFP positive GCES was confirmed by IF (Fig. 1C). We
investigated the co-expression with three known markers, GFR-a1,
CD49f, and Thy-1.2. CD49f expressed at a high level on GCES, GFR-
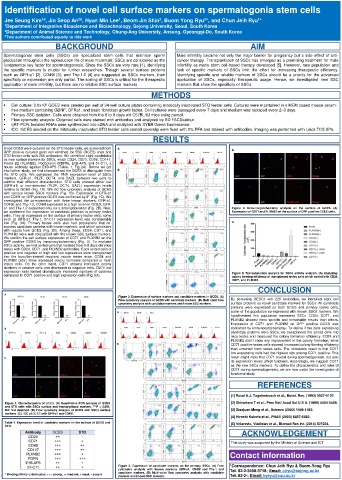
a1 and Thy-1.2 expressed only on a small population (Fig. 2B). Next, Figure 4. Immunocytochemistry analysis on the surface of GCES. (A)
we confirmed the expression of candidate proteins in primary testes Expression of CD71 and PLXNB2 on the surface of GFP positive GCES cells.
cells. They all expressed on the surface of primary testes cells, some
such as GFR-a1, Thy-1, 57-C11 expression level was considerably
low (Fig. 3A). Primary testes cells also had populations that co- A
express candidate proteins with known markers, and which consistent
with results from GCES (Fig. 3B). Among these, CD24, CD71, and
PLXN B2 were well colocalized with the known SSC surface markers.
We confirm the cell surface expression of CD71 and PLXNB2 on the
GFP positive GCES by immunocytochemistry (Fig. 4). To evaluate
SSCs activity, we first sorted cells that isolated from 6-8 days old mice
testes with CD24, CD71, and PLXNB2 antibodies. Each sorted cells of
positive and negative or high and low expression were transplanted
into the busulfan-treated recipient mouse testes mice. CD24 and
PLXNB2 didn’t show increased colony formation compared to fresh
testes cells. On the other hand, CD71 showed increased colony
numbers in positive cells and decreased in negative cells. CD71 low
expression cells formed dramatically increased numbers of colonies Figure 5. Transplantation analysis for SSCs activity analysis. (A) Analyzing
compared to CD71 positive and high expression cells (Fig. 5A). colony forming efficiency of transplanted testes cells which sorted with CD24,
CD71, and PLXNB2.
CONCLUSION
A
Figure 2. Expression of surface markers and candidate markers in GCES. (A)
Flow cytometry analysis of GCES with candidate markers. (B) Multi-color flow By screening GESCs with 225 antibodies, we identified eight cell
cytometry analysis with candidate markers and known SSC markers. surface proteins as novel candidate markers for SSCs. All candidate
proteins were expressed on both GCES and primary testes cells,
A some of the population co-expressed with known SSCs markers. We
hypothesized this population represents SSCs. CD24, CD71, and
PLXNB2 showed more specific and remarkable results than others.
Expression of CD71 and PLXNB2 on GFP positive GCES was
B confirmed by immunocytochemistry. To define if the cells expressing
candidate proteins were SSCs, we transplanted the sorted cells into
mice testes and measured the colony formation efficiency. CD24 and
PLXNB2 didn’t show any improvement in the colony formation, while
B CD71 positive testes cells showed increased colony-forming efficiency
than unsorted fresh testes cells. The noticeable result is that CD71
low expressing cells had the highest rate among CD71 positive. This
C result might imply that CD71 crucial during spermatogenesis, but also
its expression levels affect functions. Accordingly, we suggest CD71
as the new SSCs markers. To define the characteristics and roles of
CD71 during spermatogenesis, we are now under the investigation of
C
functional study.
REFERENCES
[1] Ruud A.J. Tagelenbosch et al., Mutat. Res. (1993) 0027-5107.
Figure 1. Characterization of GCES. (A) Quantitative PCR analysis of GCES [2] Shinohara T et al., Proc Natl Acad Sci U S A. (1999) 5504-5509.
and STO cells with SSCs surface and transcriptional markers. ***P < 0.001,
ND: Not detected. (B) Flow cytometry analysis of GCES with SSCs surface [3] Xiaojuan Meng et al., Science (2000) 1489-1493.
markers. (C). ICC of GCES with GFR-a1 and CD49f.
[4] Hiroshi Kubota et al., PNAS (2003) 6487-6492.
Table 1. Expression level of candidate markers on the surface of GCES and [5] Volarevic, Vladislav et al., Biomed Res Int. (2014) 507234.
STO.
ACKNOWLEDGEMENT
This study was supported by the Ministry of Science and ICT.
Contact information
Figure 3. Expression of candidate markers on the primary SSCs. (A) Flow *Correspondence: Chun Jeih Ryu & Buom-Yong Ryu
cytometry analysis with known markers, GFR-a1, CD49f and Thy-1 and Tel. 82-2-3408-3718; Email: cjryu@sejong.ac.kr
candidate markers. (B) Multi-color flow cytometry analysis with candidate
* Binding affinity is defined as: +++ strong, ++ medium, + weak, - absent
markers and known SSC markers. Tel. 82-2-; Email: byryu@cau.ac.kr