
Page 53 - I. Chemical biology and drug discovery
P. 53
Pharmacokinetics and biodistribution study of miRNA-497 using
capillary electrophoresis with laser induced fluorescence detector.
1
1
Haejin Kwon , Eunmi Ban and Eun Joo Song *
1
1 College of Pharmacy and Graduate School of Pharmaceutical Sciences, Ewha Womans University, Seoul 03760, Korea.
BACKGROUND AIM
MicroRNAs (miRNAs) are small non-coding RNAs (18-22 nucleotides long) that Here, we first validated the CE-LIF method for its sensitivity, rapidity, and
interact with their target mRNAs to regulate gene expression. miRNAs have been reliability in analyzing miRNA-497 levels in plasma and tissues. After
widely investigated as therapeutic agents to treat various diseases. Therefore, to intravenously administering miRNA-497 as a model therapeutic candidate to treat
evaluate miRNAs for therapeutic purposes, the pharmacokinetics (PK) and lung cancer, we also evaluated the PK and BD of miRNA-497 by quantitatively
biodistribution (BD) of miRNAs have been investigated after its administration.
Recent studies have shown that miRNA-497 is correlated with lung cancer. analyzing its levels in plasma and organs, such as the liver, spleen, lung, and
Besides, the studies of miRNA-497 as a therapeutic candidate have been kidney, using the validated CE-LIF method.
conducted for treating lung cancer.
METHODS
CE-LIF
100 10000
0.65 10 1000
RFU 0.55 miRNA-497 Conc. (nM) 1 miRNA-497 Conc. (nM) 100
0.45 0.01 0.1 10 1
200
0 2 4 6 8 10 Liver Lung Kidney Spleen 0 50 100 150 Time (min) 250 300 350 400
Migration time (min)
IV injection of lung miRNA analysis in plasma and organs Pharmacokinetics and biodistibution
-enriched miRNA mimic Sample collection and extraction after IV injection of miRNA mimics analysis of lung-enriched miRNA
RESULTS
Figure 1. Figure 2. Figure 3. Figure 4.
10000
1000
miRNA-497 Conc. (nM) 100 10
1
0 50 100 150 200 250 300 350 400
Time (min)
Figure 5. Table 1.
Parameters miRNA-497
(A) (B) (C)
AUC(last) (nM min) 9784.56 ± 1561.66
100 100
C max (nM) 4105.57 ± 1135.50
10 10 T max (min) 1.0
miRNA-497 Conc. (nM) 1 miRNA-497 Conc. (nM) 1 CL/F (L min -1 kg -1 ) 0.01 ± 0.0016
1.58 ± 0.59
Vz/F (L kg -1 )
0.1
0.1
T 1/2 (min) 105.71 ± 23.57
0.01 0.01 Elimination K (min -1 ) 3.68 ± 2.40
Liver Lung Kidney Spleen Liver Lung Kidney Spleen
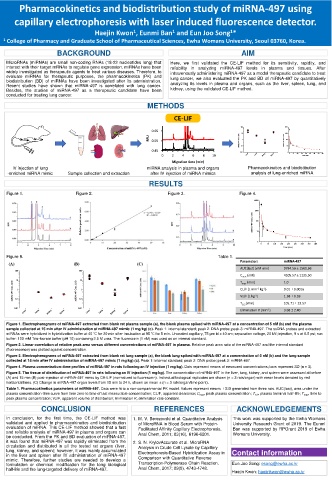
Figure 1. Electropherograms of miRNA-497 extracted from blank rat plasma sample (a), the blank plasma spiked with miRNA-497 at a concentration of 5 nM (b) and the plasma
sample collected at 15 min after IV administration of miRNA-497 mimic (1 mg/kg) (c). Peak 1: internal standard; peak 2: DNA probe; peak 3: miRNA-497. The ssDNA probes and extracted
miRNAs were hybridized in hybridization buffer at 40 ℃ for 20 min after incubation at 95 ℃ for 5 min. Uncoated capillary, 75 μm id x 40 cm; separation voltage, 20 kV; injection, 9 s at 0.5 psi; run
buffer: 100 mM Tris–borate buffer (pH 10) containing 2.5 M urea. The fluorescein (1 nM) was used as an internal standard.
Figure 2. Linear correlation of relative peak area versus different concentrations of miRNA-497 in plasma. Relative peak area ratio of the miRNA-497 and the internal standard
(fluorescence) was plotted against concentration.
Figure 3. Electropherograms of miRNA-497 extracted from blank rat lung sample (a), the blank lung spiked with miRNA-497 at a concentration of 5 nM (b) and the lung sample
collected at 15 min after IV administration of miRNA-497 mimic (1 mg/kg) (c). Peak 1: internal standard; peak 2: DNA probe; peak 3: miRNA-497.
Figure 4. Plasma concentration–time profiles of miRNA-497 in rats following an IV injection (1 mg/kg). Dots represent means of measured concentrations; bars represent SD (n = 3).
Figure 5. The tissue of distribution of miRNA-497 in rats following an IV injection (1 mg/kg). The concentration of miRNA-497 in the liver, lung, kidney, and spleen were assessed at before
(A) and 15 min (B) post-injection of miRNA-497 mimic by CE-LIF (normalized to fluorescein). Individual biological replicates are shown (n = 3 rats/organ) with mean levels denoted by red
horizontal lines. (C) Change in miRNA-497 organ levels from 15 min to 24 h, shown as mean ± (n = 3 rats/organ/time point).
Table 1. Pharmacokinetics parameters of miRNA-497. Data were fit to a non-compartmental PK model. Values represent means ± S.D generated from three rats. AUC(last), area under the
plasma concentration-time curve from time zero to time of last measurable concentration; CL/F, apparent clearance; C max , peak plasma concentration; T 1/2 , plasma terminal half-life; T max , time to
peak plasma concentration; Vz/F, apparent volume of distribution; Elimination K, elimination rate constant.
CONCLUSION REFERENCES ACKNOWLEDGEMENTS
In conclusion, for the first time, the CE-LIF method was 1. M. V. Berezovski et al. Quantitative Analysis This work was supported by the Ewha Womans
validated and applied to pharmacokinetics and biodistribution of MicroRNA in Blood Serum with Protein- University Research Grant of 2019. The Eunmi
evaluation of miRNA. This CE-LIF method showed that a fast Facilitated Affinity Capillary Electrophoresis. Ban was supported by RPGrant 2019 of Ewha
and reliable analysis of miRNA-497 in plasma and organs can Anal Chem, 2011; 83(16), 6196-6201. Womans University.
be conducted. From the PK and BD evaluation of miRNA-497,
it was found that miRNA-497 was rapidly eliminated from the 2. S. N. KrylovAccurate et al. MicroRNA
circulation and distributed in all the tested rat organs (liver, Analysis in Crude Cell Lysate by Capillary
lung, kidney, and spleen); however, it was mainly accumulated Electrophoresis-Based Hybridization Assay in Contact information
in the liver and spleen after IV administration of miRNA-497 Comparison with Quantitative Reverse
mimic. Therefore, further studies are needed to develop a
formulation or chemical modification for the long biological Transcription-Polymerase Chain Reaction. Eun Joo Song: esong@ewha.ac.kr
half-life and the lung-targeted delivery of miRNA-497. Anal Chem, 2017; 89(8), 4743-4748.
Haejin Kwon: haejinkwon@ewha.ac.kr