
Page 17 - C. Biotechnology and molecular imaging
P. 17
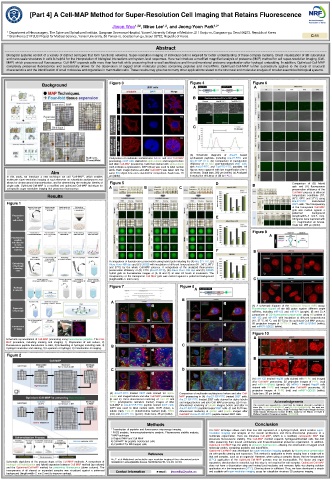
[Part 4] A Cell-MAP Method for Super-Resolution Cell Imaging that Retains Fluorescence
1,2
Jiwon Woo 1,2# , Mirae Lee , and Jeong-Yoon Park 1,2*
1 Department of Neurosurgery, The Spine and Spinal cord Institute, Gangnam Severance Hospital, Yonsei University College of Medicine, 211 Eonju-ro, Gangnam-gu, Seoul 06273, Republic of Korea
2 Brain Korea 21 PLUS Project for Medical Science, Yonsei University, 50 Yonsei-ro, Seodaemun-gu, Seoul 03722, Republic of Korea C-11
Abstract
Biological systems consist of a variety of distinct cell types that form functional networks. Super-resolution imaging of individual cells is required for better understanding of these complex systems. Direct visualization of 3D subcellular
and nano-scale structures in cells is helpful for the interpretation of biological interactions and system-level responses. Here we introduce a modified magnified analysis of proteome (MAP) method for cell super-resolution imaging (Cell-
MAP) which preserves cell fluorescence. Cell-MAP expands cells more than four-fold while preserving their overall architecture and three-dimensional proteome organization after hydrogel embedding. In addition, Optimized-Cell-MAP
completely preserves fluorescence and successfully allows for the observation of tagged small molecular probes containing peptides and microRNAs. Optimized-Cell-MAP further successfully applies to the study of structural
characteristics and the identification of small molecules and organelles in mammalian cells. These results may give rise to many other applications related to the structural and molecular analysis of smaller assembled biological systems.
Figure 3 Figure 4 Figure 6
Background A A
B
C
(A) Schematic diagrams of Ara-27 based
Comparison of multiscale architectures before and after Cell-MAP synthesized peptides, including Ara-27-FITC and
processing. 293T cells stained for alpha-tubulin and imaged before Ara-27-ISP-FITC. (B) Comparison of transduction
and after Cell-MAP processing. Cells that stained with alpha-tubulin efficiency of 18 hour post-transducted 293T cells
(red) indicate a cytoskeleton. DAPI (blue) was used to label nucleic with Ara-27-FITC and Tat-PTD-FITC peptides. All
acids. Each image (before and after Cell-MAP) was taken with the figures were captured with low magnification (20×)
Aim same 63x object lens and z-stacked for comparison. Scale bars, 15 air lenses. Scale bars, 200 μm (white). (c) Analyzed
In this study, we introduce a new technique we call “Cell-MAP”, which enables μm (white). transduction efficiency of (B) by FACS.
multiscale super-resolution imaging of such elements as subcellular architectures and
allows for ultrastructural characterization, and for determining the molecular identity of Figure 5 D Comparison of (B) hybrid
single cells. Optimized-Cell-MAP is a modified and optimized Cell-MAP technique for B gels and (A) fluorescence
cell-specific super-resolution imaging that preserves fluorescence. A B C preservation efficiency of the
Cell-MAP process at different
Results temperature conditions (RT,
95°C, 60°C and 37°C) using
Ara-27-FITC transducted
Figure 1 293T cells. The transparency
of the transparent Cell-MAP
gels was evident against a
patterned background
E (length:width=5 mm:5 mm).
All figures were captured with
20x magnification air lenses.
Scale bar, 200 μm (white).
Figure 9
A
F B
A comparison of fluorescence preservation using hybrid gels including the (A) Ara-27-FITC, (B)
Alexa Fluor 488 dye and (C) QD525 with incubation of different temperatures (RT, 95°C, 60°C
and 37°C) by the whole Cell-MAP process. A comparison of the analyzed fluorescence
preservation efficiency of (D) FITC (Ara-27-FITC), (E) Alexa Fluor 488 dye and (F) QD525
hybrid gels on fluorescence images of (A, B and C) at after 24 hours of incubation. The
transparency of the transparent Cell-MAP gels was evident against a patterned background
(length:width=5 mm:5 mm). C
Figure 7 Figure 8
A
B
A
(A) A schematic diagram of the molecular beacon (MB) assay.
Fluorescence signals of the MB probe against different target
miRNAs, including miR-122 and miR-671 (purple). (B and C) A
comparison of QD fluorescence preservation using MB probes of
miR-122 and miR-671 with incubation at different temperatures
(RT, 37 °C, 60 °C, and 95 °C) by the optimized-Cell-MAP process.
3D projection images of SYTO-17 (red), miR122-QD565 (white),
and miR671-QD525 (white).
Figure 10
A
Schematic representation of Cell-MAP processing using fluorescence peptides. The Cell-
MAP procedure, including staining and imaging: 1) Preparation of cell culture, 2)
Fluorescence peptide transduction to cells, 3) Embedding of hydrogel, including cells, 4) B C
Hydrogel incubation and staining, 5) Expansion of hydrogel, 6) Construction of imaging.
Figure 2
B
C D
(A) miR-122 treated Hep3B cells stained with PI-PE and imaged
after Cell-MAP processing. 3D projection images of PI-PE (red)
and miR122-QD565 (green). (B) MiR-671 treated Hep3B cells
stained with PI-PE and imaged after Cell-MAP processing. 3D
projection images of PI-PE (red) and miR671-QD525 (white).
(A) Ara-27-FITC treated 293T cells stained for alpha- Comparison of multiscale architectures before and after Cell- Scale bars: 20 μm (white).
tubulin and imaged before and after Cell-MAP processing. MAP processing in (A) Ara-27-ISP-FITC treated 293T cells.
(B and C) Three-dimensional rendering of Tom 20 and Ara-27-ISP-FITC treated 293T cells stained for alpha-tubulin
KEDL (endoplasmic reticulum marker) images of after and imaged before and after Cell-MAP processing. (B) Three- Acknowledgements
Cell-MAP in Ara-27-ISP-FITC peptide treated 293T cells. dimensional rendering of tubulin images before and after in This research was supported by a grant from the National Research Foundation of
DAPI was used to label nucleic acids. DAPI (blue), a- Ara-27-ISP-FITC peptide treated 293T cells. (C and D) Three- Korea (No. 2017R1D1A1B03030315, and 2017R1D1A1B03029560). This work was
tubulin (red), Tom-20 (mitochondria marker) (red), KEDL dimensional rendering of giantin and β-actin images after supported by a grant from the Korea Health Technology R&D Project through the Korea
Health Industry Development Institute (KHIDI), funded by the Ministry of Health &
(red) and Ara-27-FITC (green). Scale bars, 20 μm (white). Cell-MAP in Ara-27-ISP-FITC peptide treated 293T cells. Welfare, Republic of Korea (grant number: HI17C1260).
Methods Conclusion
* Transfection of peptides and fluorescence microscopy imaging. The MAP technique allows more than four-fold expansion of a hydrogel hybrid, which enables super-
* FACS analysis, Immunocytochemistry analysis, Fluorescence stability analysis. resolution imaging and analysis of the overall architecture and three-dimensional proteome of a
* MAP technique multiscale organization. Here we introduce Cell-MAP, which is a modified, cell-specific MAP that
i) Original MAP and Cell-MAP preserves fluorescence stability. The Cell-MAP method expands hydrogel-embedded cells four-fold
ii) Cell-MAP for peptide transfected cells while preserving their overall architecture and three-dimensional proteome organization. In addition,
iii) Cell-MAP for MB-treated cells Optimized-Cell-MAP has the ability to preserve fluorescence, allowing the observation of tagged small
molecular probes containing peptides and microRNAs.
Optimized-Cell-MAP was developed for super-resolution imaging analysis by fluorescence preservation
Reference via cell-specific clearing and expansion. This method is applicable at levels ranging from a single cell to
that cell complex, such as an organoid. However, when using a complex tissue, the low temperature
Ku, T. et al. Multiplexed and scalable super-resolution imaging of three-dimensional protein (37°C) application of the Optimized-Cell-MAP process may be incompatible. For tissue and organ
Schematic depictions of the process steps of the Cell-MAP methods. A comparison of localization in size-adjustable tissues. Nat Biotechnol 34, 973-981 (2016). expansion, denaturation is essential, but this step is not required for cell samples. Optimized Cell-MAP
hydrogel-cell hybridization and hybrid expansion between Cell-MAP method (up column) does not have a dissociation step and instead just incubates and removes lipids via clearing solution
and the Optimized-Cell-MAP method for preserving fluorescence (down column). The application at a low temperature (37°C). Clearing alone is sufficient. Thus, we have developed a simple
transparency of all cleared or expanded samples was visualized against a patterned Contact Information e-mail : jiwonflu@yuhs.ac and scalable cell super-resolution imaging assay for subcellular structure 3D proteome imaging.
background (length:width=2 mm:2 mm) to improve contrast.