
Page 17 - A. Aging
P. 17
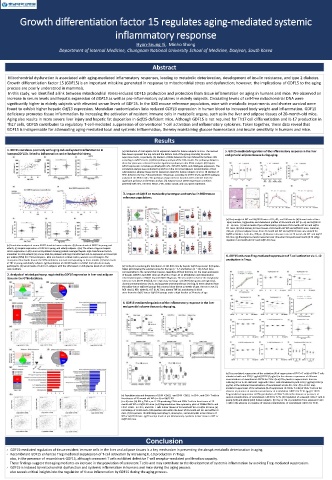
Growth differentiation factor 15 regulates aging-mediated systemic

                                       inflammatory response
                                             Hyon-Seung Yi,  Minho Shong
                    Department of Internal Medicine, Chungnam National University School of Medicine, Daejeon, South Korea

                                                   Abstract
    Mitochondrial dysfunction is associated with aging-mediated inflammatory responses, leading to metabolic deterioration, development of insulin resistance, and type 2 diabetes.
   Growth differentiation factor 15 (GDF15) is an important mitokine generated in response to mitochondrial stress and dysfunction; however, the implications of GDF15 to the aging
   process are poorly understood in mammals.
    In this study, we identified a link between mitochondrial stress-induced GDF15 production and protection from tissue inflammation on aging in humans and mice. We observed an
   increase in serum levels and hepatic expression of GDF15 as well as pro-inflammatory cytokines in elderly subjects. Circulating levels of cell-free mitochondrial DNA were
   significantly higher in elderly subjects with elevated serum levels of GDF15. In the BXD mouse reference population, mice with metabolic impairments and shorter survival were
   found to exhibit higher hepatic Gdf15 expression. Mendelian randomization links reduced GDF15 expression in human blood to increased body weight and inflammation. GDF15
   deficiency promotes tissue inflammation by increasing the activation of resident immune cells in metabolic organs, such as in the liver and adipose tissues of 20-month-old mice.
   Aging also results in more severe liver injury and hepatic fat deposition in Gdf15-deficient mice. Although GDF15 is not required for Th17 cell differentiation and IL-17 production in
   Th17 cells, GDF15 contributes to regulatory T-cell-mediated suppression of conventional T-cell activation and inflammatory cytokines. Taken together, these data reveal that
   GDF15 is indispensable for attenuating aging-mediated local and systemic inflammation, thereby maintaining glucose homeostasis and insulin sensitivity in humans and mice.
                                                   Results
   1. GDF15 correlates positively with aging-induced systemic inflammation in   (a) Distribution of 226 hepatic GDF15 expression levels for human subjects in GTEx. The red and   5. GDF15-mediated regulation of the inflammatory response in the liver
   humansGDF15 is linked to inflammation and mitochondrial stress  blue boxes represent the top 25% and the bottom 25% of the group according to GDF15   and gonadal adipose tissues during aging.
                                         expression levels, respectively. (b) Number of DEGs between the top 25% and the bottom 25%
                                         according to GDF15 levels. (c) KEGG pathway analysis of the DEA results. The pathways shown in
                                         these bar plots were selected from the significant pathways in the KEGG analysis. (d) Hepatic
                                         GDF15 expression correlates positively with AP1, TNFAIP3, NOD2, and CD44 gene expression. The
                                         correlation analysis was conducted by GEPIA2 in the GTEx liver dataset. (e) Distribution of 633
                                         subcutaneous adipose tissue GDF15 expression levels for human subjects in GTEx. (f) Number of
                                         DEGs between the top 25% and bottom 25% groups according to GDF15 levels. (g) KEGG pathway
                                         analysis of the DEA results. The pathways shown in these bar plots were selected from the
                                         significant pathways in the KEGG analysis. (h) Adipose tissue GDF15 expression correlates
                                         positively with AP1, TNFAIP3, NOD2, IFNG, CD44, CD11B, and CCL2 gene expression.
                                         3. Impact of Gdf15 on metabolic phenotypes and survival in BXD mouse
                                         reference populations.
                                                                           (a) Body weight of WT and Gdf15 KO mice at 10-, 40-, and 100-weeks. (b) Serum levels of liver
                                                                           injury markers, triglyceride, and cholesterol profiles of 20-month-old WT (n = 6) and Gdf15 KO
                                                                           (n = 6) mice.  (c) Serum levels of pro-inflammatory cytokines of 20-month-old WT and Gdf15
                                                                           KO  mice. (d) H&E staining for liver tissues of 20-month-old WT and Gdf15 KO mice. Scale bar,
                                                                           200 μm. (e) Fixed adipose tissue from 20-month-old WT and Gdf15 KO mice was stained for
                                                                           F4/80 antibodies. Scale bar, 200 μm. (f) Glucose tolerance tests of 20-month-old WT  and Gdf15
                                                                           KO mice. (g) Blood glucose levels measured over time after intraperitoneal insulin (0.75 U/kg)
                                                                           injection in 20-month-old WT and Gdf15 KO mice.
   (a) Correlation analysis of serum GDF15 levels in human subjects.  (b) Serum levels of GDF15 in young and
   elderly. (c) Hepatic expression of GDF15 in young and elderly subjects. (d,e) The effect of age on hepatic
   GDF15 expression in (d) a microarray dataset showing patient-averaged hepatic log2-transformed GDF15
   intensities for 202 patients (e) a GTEx RNA-Seq dataset with log2-transformed GDF15 expression in transcripts   6. GDF15 enhances Treg-mediated suppression of T-cell activation via IL-10
   per million (TPM) for 226 liver biopsies. Men are denoted as black circles, women as red triangles. The
   transparent blue bands denote the 95% confidence intervals corresponding to these models. (f) Serum levels   production in Tregs.
   of TNF in young and elderly subjects. (g) Quantitation of mtDNA levels in ccf-DNA from plasma in study
   participants. (h) Serum levels of GDF15 in subjects with the 20% lowest or 20% plasma levels of ccf-mtDNA  (a) Violin plot visualizing the distribution of 241 BXD mice by hepatic Gdf15 expression (b) Kaplan–
   copy numbers.                         Meier plot showing the survival curves for the top (n = 37) and bottom (n = 36) 25% of mice
                                         corresponding to the red and blue squares, regardless of their BXD line. (c) The mean expression
   2. Analysis of related pathways regulated by GDF15 expression in liver and adipose   of hepatic Gdf15 in each BXD strain at 29 weeks of age. (d–o) Metabolism and inflammation-
   tissue in the GTEx database.          related phenotypes of Gdf15-low and Gdf15-Hi groups. The area under curve for the oral glucose
                                         tolerance test (OGTT AUC) (d), the respiratory exchange ratio (RER) during day and night (e,f),
                                         alanine aminotransferase (ALT), and aspartate aminotransferase (AST) (g, h) were obtained from
                                         the Gdf15-low or Gdf15-Hi groups fed a normal chow diet at 29 weeks of age. The OGTT AUC (i),
                                         RER_day (j), RER_night (k), AST (l), ALT (m), plasma TNF (n), and plasma IL-10 (o)
                                         were from the Gdf15-low or Gdf15-Hi groups under a high-fat diet at 29 weeks of age.
                                         4. GDF15-mediated regulation of the inflammatory response in the liver
                                         and gonadal adipose tissues during aging.


                                                                           (a) Treg-mediated suppression of the activation (% of suppression of CD25+ T cells) of CD4+ T cells
                                                                           stimulated with anti-CD3 (2 μg/mL)/CD28 (5 μg/mL) in the absence or presence of different
                                                                           concentrations of recombinant GDF15 for 72 hr. (b–e) IFN-γ levels in supernatants from co-
                                                                           culturing WT or IL-10- deficient Tregs with CD4+ T cells stimulated by anti-CD3 (2 μg/mL)/CD28 (5
                                                                           μg/mL) at the indicated concentrations  of recombinant GDF15 for 72 hr. (f) IL-10 KO Treg-
                                                                           mediated suppression of the activation (% of suppression of CD25+ T cells) of CD4+ T cells in the
                                                                           absence or presence of several concentrations  of recombinant GDF15 for 72 hr. (g–j) IL-10 KO
                                         (a) Population size and frequency of CD44+CD62L− and CD44−CD62L− in CD4+, and CD8+ T cells in   Treg-mediated suppression of IFN-γ production of CD4+ T cells in the absence or presence of
                                                                           several concentrations  of recombinant GDF15 for 72 hr. (k) Population of senescent  CD8+ T cells in
                                         liver tissues of 20-month-old WT (n = 6) or Gdf15 KO
                                         (n = 6) mice. (b) IFN-γ, TNF-α, or IL-17A producing CD4+ and CD8+ T cells in liver tissues of 20-  young (≤40) and elderly (≥60) human subjects. (l) IFN-γ or TNF-α production from senescent CD8+
                                         month-old WT or Gdf15 KO mice. (c,d) Representative flow cytometry plots of CD44+CD62L− and   T cells in the absence or presence of several concentrations  of recombinant GDF15 for 48 hr.
                                         CD44−CD62L− in CD4+, and CD8+ T cells in liver tissues of 20-monthold WT or Gdf15 KO mice. (e)
                                         Percentage of CD11b and F4/80-positive cells within the livers of 20-month-old WT and Gdf15 KO
                                         mice. (f) Frequencies of infiltrating macrophages, monocytes,  and neutrophils in liver tissues of
                                         WT or Gdf15 KO mice. (g) Transcript levels of pro inflammatory cytokines in liver tissues of WT or
                                         Gdf15 KO mice.
                                                 Conclusion
   › GDF15-mediated regulation of tissue resident immune cells in the liver and adipose tissues is a key mechanism in preventing the abrupt metabolic deterioration in aging.
   ›  Recombinant GDF15 enhances Treg mediated suppression of T-cell activation by increasing IL-10 production in Tregs.
    also, in the presence of recombinant GDF15, although senescent T cells exhibited defective T-cell receptor-mediated proliferation capacity.
    These findings suggest that aging mediates an increase in the population of senescent T cells and may contribute to the development of systemic inflammation by avoiding Treg-mediated suppression.
   ›  GDF15 is induced by mitochondrial dysfunction and systemic inflammation in humans and mice during the aging process.
    also reveals critical insights into the regulation of tissue inflammation by GDF15 during the aging process.