


Page 28 - ebook
P. 28
C-to-G Base Editing Increases Oleic Acid Production

                                 without any growth defects
                                                                     1,2
                                                        2
                                              1
                                  Mid-Eum Park , Yuli Choe , Hyun Uk Kim *
                     1 Department of Molecular Biology, Plant Engineering Research Institute, Sejong University, Seoul 05006, Korea,
               2 Department of Bioindustry and Bioresource Engineering, Plant Engineering Research Institute, Sejong University, Seoul 05006, Korea
                          Abstract                             A                                  B
     The demand for vegetable oil is steadily increasing worldwide for dietary purposes and cooking. It is
     often desirable to reduce unsaturation levels of fatty acids to increase storage stability and prevent
     vegetable oils from turning rancid and reduce the amount of trans-fat generation during cooking.
     Functional disruption of FATTY ACID DESATURASE 2 (FAD2) prevents the conversion of oleic acid
     (18:1) to linoleic acid (18:2), thereby enhancing the production of the desirable oleic acid. Here, we
     aimed to attenuate FAD2 activity in planta while avoiding adverse growth effects by introducing
     amino-acid substitutions using CRISPR base editors. In Arabidopsis, we applied the adenine base
     editor (ABE) and cytosine base editor (CBE) to induce semi-random base substitutions within
     several FAD2 coding regions. Isolation of base-edited fad2 alleles with higher oleic acid revealed  C  D
     that the CBE application induced C-to-T and/or C-to-G base substitutions within the targeted
     sequences, resulting in an alteration of the FAD2 enzyme activities. For example, fad2-144 with
     multiple C-to-G base substitutions showed fewer growth defects but with a significant increase in
     oleic acids by 3-fold higher than wild type. Our “proof-of-concept” approach suggests that the
     equivalent alleles may be recapitulated in vegetable oil crops via precision genome editing for
     practical cultivation.
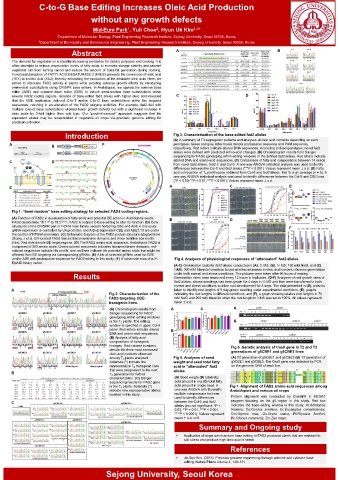
                        Introduction                          Fig 3. Characterization of the base-edited fad2 alleles
                                                              (A) A summary of T3 segregation patterns and analyses of oleic acid contents depending on each
    A                                F                        genotypes. Green and grey letter boxes denote protospacer sequence and PAM sequence,
                   B
                                                              respectively. Red letters indicate altered DNA sequences. According to fixed genotypes, novel fad2
                                                              alleles were defined with predicted amino-acid changes. (B) Chromatogram results from Sanger
                                                              sequencing for FAD2 genotyping within editing windows in the defined fad2 alleles. Red letters indicate
                                                              altered DNA and amino-acid sequences. (C) Comparison of fatty acid compositions between T4 seeds
    C              D
                                                              from novel fad2 alleles, fad2-1, and Col-0. A one-way ANOVA statistical analysis was used to identify
                                                              differences between the Col-0 and fad2 alleles (***P < 0.001). Values represent mean ± s.d. (D) Fatty
                                                              acid composition of T 4 plant leaves obtained from Col-0 and fad2 alleles. Mol % is an average (n = 5). A
                                                              one-way ANOVA statistical analysis was used to identify differences between the Col-0 and CBE lines
                                                              (*P < 0.05; **P < 0.01; ***P < 0.001). Values represent mean ± s.d.
    E                                                        A                    C                    E

     Fig 1. “Semi-random” base editing strategy for selected FAD2 coding regions.
     (A) Function of FAD2 in desaturation of fatty acids and potential BE action in Arabidopsis seeds.   B  D
     FAD2 desaturates 18:1 Δ9 to 18:2 Δ9,12 . FAD2 is subject to base editing to alter its function. (B) Core
     structures of the CRISPR part in T-DNA from binary vectors harboring CBE and ABE in this study.   F
     gRNA expression is controlled by U6 promoter, and AIDv2-dependent CBE and ABE7.10 are under
     the control of RPS5A promoters. (C) Schematic diagram of the FAD2 protein structure adapted from
     Zhang, J et al. ER-located FAD2 has six transmembrane domains and three histidine box motifs
     (His). Red dots denote BE target regions. (D) The FAD2 amino-acid sequence. Arabidopsis FAD2 is
     composed of 383 amino acids. Green-colored sequences indicates transmembrane domains, red-
     colored sequences indicate His motifs, and red lines indicate the potential amino acids that might be
     affected from BE targeting via corresponding gRNAs. (E) A list of selected gRNAs used for CBE
     and/or ABE with protospacer sequence for FAD2 editing in this study. (F) A schematic map of pJY-  Fig 4. Analyses of physiological responses of “attenuated” fad2 alleles
     RpAID binary vector.
                                                              (A-C) Germination tests for fad2 alleles conducted in (A), ½ MS, (B), ½ MS; 150 mM NaCl, and (C),
                                                              ½MS; 300 mM Mannitol condition to test whether increases in oleic acid content influence germination
                                                              under both normal and stress conditions. The pictures were taken after 96 hours of sowing.
                           Results                            Germination rates were measured every 12 hours in triplicates. (D-F) Analyses of root growth rates of
                                                              fad2 alleles, whose seedlings had been grown for 4 days in ½ MS and then were transferred to both
                                                              normal and stress conditions to allow root development for 5 days. The data presented in (D), pictures
     A                                                        taken to identify root lengths of 5 day-grown seedling under experimental conditions, (E), graphs
                                       Fig 2. Characterization of the   indicating the root lengths in different conditions, and (F), a graph showing relative root lengths in 75
                                       FAD2-targeting CBE-    mM NaCl and 200 mM Mannitol when the root length in ½MS was set to 100%. All values represent
                                       transgenic lines.      mean ± s.d.
                                        (A) Chromatogram results from   A  C       A
                                        Sanger sequencing for FAD2
                                        genotyping within editing windows
                                        in the T 2 plants. The editing             B
                                        window is specified in upper Col-0
                                        panel. Red letters indicate altered   B
                                        DNA and amino-acid sequences.
                                        (B) Analysis of fatty acid
                                        compositions of transgenic
                                        lineages. Red-colored numbers             Fig 6. Genetic analysis of Cas9 gene in T2 and T3
                                        denote the three most increased           generations of g5CBE1 and g5CBE3 lines
                                        oleic acid contents observed
                                        among T 2 plants analyzed.   Fig 5. Analyses of seed   (A) T2 generation of g5CBE1 and g5CBE3 (B) T3 generation of
                                        Asterisks (*) indicate the   weight and seed total fatty   g5CBE1 and g5CBE3. The Cas9 gene was detected by PCR
                                        representative T 2 transgenic lines   acid in “attenuated” fad2  on the genomic DNA of each line.
                                        that were progressed to the next   alleles
     B                                  T 3 generation for further
                                        characterization. (C) Sanger   (A) Seed weight (B) total fatty
                                        sequencing results for FAD2 gene   acid amount in mg (C) total fatty
                                        in the T 3 plants. Asterisks (*)   acid amount in single seed. A   Fig 7. Alignment of FAD2 amino-acid sequences among
                                        indicate new representative alleles   one-way ANOVA with Dunnett's   Arabidopsis and various oil crops
                                        isolated in this study.   multiple comparisons test was
                                                              used to identify differences   Protein alignment was conducted by ClustalW in MEGA7
     C                                                        between the Col-0 and fad2  program focusing on the g5 region in this study. Red box
                                                              alleles (ns=not significant, *P <   indicates the base editing window in this study. At:Arbidopsis
                                                              0.05, **P < 0.01, ***P < 0.001,   thaliana, Ca:Corylus avellana, Ec:Eucalyptus camaldulensis,
                                                              ****P < 0.0001). Values represent   Gm:Glycine max,  Os:Oryza sativa,  Pf:Physaria fendleri,
                                                              mean ± s.d. n=5.    Rc:Ricinus communis, Zm:Zea mays.
                                                                       Summary and Ongoing study
                                                               ü  Application of target semi-random base editing to FAD2 produced plants that are resistant to
                                                                  salt stress and produce high oleic acid in seeds.
                                                                                  References
                                                               ü  Jin-Soo Kim. (2018)  Precision genome engineering through adenine and cytosine base
                                                                  editing, Nature Plants volume 4, 148–151.
                                      Sejong University, Seoul Korea

