


Page 17 - ebook
P. 17
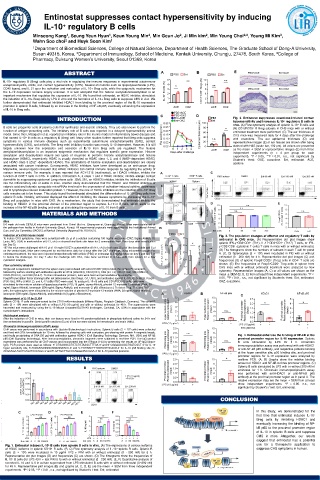
Entinostat suppresses contact hypersensitivity by inducing
IL-10 regulatory B cells
+
Minseong Kang , Seung Yeun Hyun , Keun Young Min , Min Geun Jo , Ji Min kim , Min Yeung Choi , Young Mi Kim ,
1
1
3
2,3
2
2
2
Wahn Soo choi and Huyk Soon Kim 1
2
1 Department of Biomedical Sciences, College of Natural Science, Department of Health Sciences, The Graduate School of Dong-A University,
Busan 49315, Korea, Department of Immunology, School of Medicine, Konkuk University, Chungju, 27478, South Korea, College of
2
3
Pharmacy, Duksung Women’s University, Seoul 01369, Korea
ABSTRACT
IL-10+ regulatory B (Breg) cells play a vital role in regulating the immune responses in experimental autoimmune
encephalomyelitis, colitis, and contact hypersensitivity (CHS). Several sti-mulants such as lipopolysaccharide (LPS),
CD40 ligand, and IL-21 spur the activation and maturation of IL-10+ Breg cells, while the epigenetic mechanism for
the IL-10 expression remains largely unknown. It is well accepted that the histone acetylation/deacetylation is an
important mechanism that regulates the expression of IL-10. We found that entinostat, an HDAC inhibitor, stimulated
the induction of IL-10+ Breg cells by LPS in vitro and the formation of IL-10+ Breg cells to suppress CHS in vivo. We
further demonstrated that entinostat inhibited HDAC1 from binding to the proximal region of the IL-10 expression
promoter in splenic B cells, followed by an increase in the binding of NF-κB p65, eventually enhancing the expression
of IL-10 in Breg cells.
INTRODUCTION Fig. 2. Entinostat suppresses oxazolone-induced contact
hypersensitivity and increases IL-10 regulatory B cells in
+
vivo. (A) Flow cytometry analysis of splenic IL-10 B cells and
+
B cells are progenitor cells of plasma cells that synthesize and secrete antibody. They are also known to perform the (B) CD1d CD5 B Breg subsets in CHS mice with or without
+
hi
function of antigen-presenting cells. The inhibitory role of B cells was reported in a delayed hypersensitivity animal entinostat treatment were performed. (C) The ear thickness of
model. Since then, Mizoguchi et al. reported an inhibitory role in the murine model of inflammatory bowel disease and CHS mice was measured daily for 4 days after the challenge
+
first named IL-10 B cells as a regulatory B (Breg) cell. Many other studies further reported that Breg cells suppress with oxazolone. The ear epidermal thickness (D) and
symptoms in various immune diseases such as experimental autoimmune encephalomyelitis (EAE), contact representative images (E) of ear tissues are shown after being
hypersensitivity (CHS), and arthritis. The Breg cells’ inhibitory function was mostly IL-10 dependent. However, it is still stained with H&E (scale bar, 100 μm). All values are presented
largely unknown how the expression and secretion of IL-10 from Breg cells are regulated. The histone as the mean ± SEM or representative images (E) from three
acetylation/deacetylation is an important epigenetic mechanism that regulates specific gene expression. Histone independent experiments (n = 4 per group for each
acetylation and deacetylation require two types of enzymes to perform: histone acetyltransferase and histone experiment). *P < 0.05, **P < 0.01, n.s., not significant by
deacetylase (HDAC), respectively. HDAC is usually classified as HDAC class 1, 2, and 4 (NAD -dependent HDAC) Student’s t-test. OXZ, oxazolone. Ent, entinostat. ACE,
+
and HDAC class 3 (Zn2 -dependent HDAC). The anomalisms of histone acetylation and deacetylation are closely acetone.
+
associated with cancer incidence. Consequently, HDAC inhibitors have been developed as an anti-cancer drug.
Meanwhile, several reports revealed that HDAC inhibitors can control immune response by regulating the activity of
various immune cells. For example, it was reported that ACY-1215 (ricolinostat), an HDAC6 inhibitor, inhibits the
function of CD8 T cells in CHS. In addition, trichostatin A, a class 1 and 2 HDAC inhibitor, inhibits allergic contact
+
dermatitis by suppressing epidermal Langerhans cells . BML-281, an HDAC6 inhibitor, inhibits the infiltration of B cells
into the inflammatory site of colitis in mice. Another study demonstrated that the HDAC1 and HDAC2 inhibitors of
valproic acid and butyrate upregulate microRNAs involved in the expression of activation-induced cytidine deaminase
and B lymphocyte-induced maturation protein-1. However, the role of HDAC inhibitors on the induction of IL-10 Breg
+
cells remains yet to be known. This study found that entinostat stimulated the differentiation of IL-10 Breg cells from
+
splenic B cells. Notably, entinostat displayed the effect of inhibiting the disease symptoms by increasing the IL-10 +
Breg cell population in mice with CHS. As a mechanism, the study first demonstrated that entinostat inhibits the
binding of HDAC1 in the proximal domain of the promoter region to express IL-10 in B cells, which leads to the
increase of the NF-kB p65 binding and ends up stimulating the expression of IL-10 from B cells.
MATERIALS AND METHODS
Mice
5-6 week old male C57BL/6 mice were purchased from Orient Bio Inc. (Seongnam-si, Gyeonggi, Korea). Mice were maintained at
the pathogen-free facility in Konkuk University (Seoul, Korea). All experimental protocols were approved by the Institutional Animal
Care and Use Committee (IACUC) at Konkuk University (Approval No. KU18127).
Induction of a CHS mouse model Fig. 3. The population changes of effector and regulatory T cells by
To induce CHS symptoms, mice were sensitized with 25 μl of a solution containing 100 mg/ml oxazolone (OXZ; Sigma-Aldrich, St. entinostat in CHS mice. (A) Representative dot plot images show
Louis, MO, USA) in acetone/olive oil (4:1, v/v) on shaved hind flank skin twice for 2 consecutive days. Four days after sensitization splenic IFN-γ CD3 CD4 (Th1), IL-17 CD3 CD4 (Th17) T cells, or IFN-
+
+
+
+
+
+
(on Day 5), + + +
197 the mice were challenged with 10 μl of 10 mg/ml OXZ in acetone/olive oil (4:1, v/v) to both ears (5 μl of the dorsal side and 5 μl γ CD3 CD8 (cytotoxic T cells) T cells in mice with or without entinostat.
on the ventral side). Mice were measured for ear thickness daily for 4 days after the OXZ challenge, using micrometer gauge. For (B) The histograms show the numbers of subsets in each T cell for panel
6
entinostat treatment, the mice were injected intraperitoneally with vehicle (PBS) or entinostat (2.5 mg/kg) twice on day 0 and day 5 (1 A. (C, D) Splenocytes (3 × 10 ) were incubated in PIB with or without
hr before the challenge). On Day 7 after the challenge with OXZ, mice were sacrificed to isolate cells from spleen for a flow entinostat (0 - 200 nM) for 4 h. Representative dot plot images (C) and
cytometric analysis. frequencies (D) of splenic Foxp3 CD25 (Treg) cells in CD4 T cells are
+
+
+
shown. (E) The frequencies of Foxp3 CD25 Treg cells in spleen from
+
+
Flow cytometry analysis CHS mice with or without entinostat treatment were analyzed by flow
Single-cell suspensions isolated from the spleen were preincubated with anti-CD16/32 (93) to block the surface Fc receptors,
followed by surface staining with antibodies specific to CD19 (eBio1D3), CD1d (1B1), CD5 (53-7.3), CD3 (17A2), CD4 (RM4-5), cytometry. Representative images (A, C) or all values are shown as the
CD25 (PC61.5), and CD8 (53-6.7). To stain intracellular proteins, cells were fixed and permeabilized by using the mean ± SEM (B, D, E) from at least three independent experiments. *P<
Foxp3/Transcription factor staining buffer set (eBioscience, San Diego, CA, USA), and antibodies against IL-10 (JES5-16E3), Foxp3 0.05, **P<0.01, n.s., not significant by Student’s t-test. Ent, entinostat.
(FJK-16s), INF-γ (XMG1.2), and IL-17 (eBio17B7) were used. To analyze IL-10+ B cells and CD1d CD5 B cells, cells were OXZ, oxazolone.
hi
+
stimulated by the mixture solution of lipopolysaccharide (LPS; 10 μg/ml; sigma-Aldrich), phorbol 12-myristate 13-acetate (PMA; 50
ng/ml; Sigma-Aldrich), ionomycin (500 ng/ml; Sigma-Aldrich), and monensin (2 μM; eBioscience). To detect Treg, Th1, and Th17
cells, the splenocytes were stimulated by the mixture solution of phorbol 12-myristate 13-acetate (PMA; 50 ng/ml; sigma-Aldrich),
ionomycin (500 ng/ml; Sigma-Aldrich), and brefeldin A (3 μg/ml; eBioscience).
Measurement of IL-10 by ELISA
Splenic CD19+ B cells were pre-sorted by the CD19 mAb-microbeads (Miltenyi Biotec, Bergisch Gladbach, Germany). The sorted B
6
cells (3 × 10 ) were stimulated with or without LPS (10 μg/ml) and with or without entinostat for 48 h. The supernatants were
harvested and measured by using the IL-10 Mouse Uncoated ELISA Kit (Invitrogen, Carlsbad, CA, USA) in accordance with the
manufacturer’s instructions.
Histological analysis
After the induction of CHS in mice, their ear tissues were fixed in 4% paraformaldehyde in phosphate-buffered saline for 24 h and
then embedded in paraffin. Serial paraffin sections (5 μm) of the ear were stained for hematoxylin and eosin (H&E).
Chromatin immunoprecipitation (ChIP) assay
ChIP assay was performed in accordance with Upstate Biotechnology’s instructions. Splenic B cells (2 × 10 cells) were collected
7
and fixed with 37% formaldehyde for 10 min, followed by shearing cells with sonication, pre-clearing with protein A magnetic beads,
and finally precipitating of DNA (50 μg) with antibodies against HDAC1 (Cell Signaling Technology, Danvers, MA, USA) and NF-kB Fig. 4. Entinostat enhances the binding of NF-kB at the
p65 (Cell Signaling Technology). After immunoprecipitation, chromatin fragments were subjected to real-time PCR. The IgG control proximal promoter region for IL-10 expression. Splenic
experiment was performed for all ChIP assays and incorporated into the IP/Input (1%) by presenting the results as (IP-IgG)/(Input- B cells stimulated by LPS for 1 h. Chromatin
IgG). PCR primers were used as follows: 5’-CTGAGGCCTGTCTGTAAGCTTTGA-3’ and 5’-CGGAAGGGCTGATCGCT-3’ for IL-10 immunoprecipitation assay was performed with anti-HDAC1
hyper sensitivity site; 5’-TAGAAGAGGGAGGAGGAGCC-3’ and 5’-TGTGGCTTTGGTAGTGCAAG-3’ for IL-10 p50 binding site; 5’- or anti-NF-kB p65 antibody, and respective proteins binding
ACGAAGA AGCTCAGATCCCAGC-3’ and 5’-GTTGCTTGCCCAGGGTACAGAA-3’ for IL-10 proximal promoter.
at the hyper sensitive site, p50 binding site, and proximal
RESULTS promoter regions for IL-10 expression were analyzed by
realtime PCR. (A, B) Graphs show the relative binding
amount of HDAC1 and NF-kB to three promoter regions. (C)
Splenic B cells stimulated by LPS with or without 200 nM of
entinostat for 1 h. Chromatin immunoprecipitation assay
was performed with anti-HDAC1 or anti-NF-kB p65
antibody at the proximal promoter region as in panel A. The
relative expression data are the mean ± SEM from at least
three independent experiments. *P < 0.05. n.s., not
significant by Student’s t-test. Ent, entinostat.
CONCLUSION
In this study, we demonstrated for the
first time that entinostat induces IL-10 +
Breg cells by inhibiting HDAC1 and
eventually increasing the binding of NF-
kB p65 to the proximal promoter region
of IL-10 in splenic B cells and suppress
CHS in mice. Altogether, our results
suggest that entinostat has a potential
Fig. 1. Entinostat induces IL-10 B cells from splenic B cells in vitro. (A) The expressions of various isoforms use for a therapeutic application to
+
of HDAC isoforms in splenic CD19 B cells. (B, C) Flow cytometry analysis of IL-10 splenic B cells. Splenic B suppress CHS symptoms in human.
+
+
cells (3 × 10 ) were incubated in 10 μg/ml LPS + PIM with or without entinostat (0 - 200 nM) for 5 h.
6
Representative dot plot images (B) and frequencies (C) are shown. (D) The histograms show the frequencies of
IL-10 B cells (for LPS 43 h + last PIM 5 h) with or without entinostat (0 - 200 nM). (E, F) Quantitative analysis of
+
secreted IL-10 and IL-6 in culture supernatant from LPS-stimulated B cells with or without entinostat (0~200 nM)
for 48 h. Representative plot images (B) and graphs (A, C, D, E) are the mean ± SEM from three independent
experiments. *P<0.05, **P<0.01, n.s., not significant by Student’s t-test. Ent, entinostat.

