


Page 57 - ebook
P. 57
Therapy induced senescent tumor cells promotes
                                  cancer stemness in breast cancer

                                                          4,5
                                     Dong Hyun Lee 1,5  Yong Won Choi , Jang-Hee Kim 2,3,5  & Tae Jun Park  1,2,5
                               1 Department of Biochemistry and Molecular Biology, Ajou University School of Medicine Suwon 16499, Korea;
                                2 Department of Biomedical Sciences, Ajou University Graduate School of Medicine Suwon 16499, Korea;
                                      3 Department of Pathology, Ajou University School of Medicine Suwon 16499, Korea;
                                  4 Department of Hematology-Oncology, Ajou University School of Medicine Suwon 16499, Korea;
                                 5 Inflamm-Aging Translational Research Center, Ajou University Medical Center Suwon 16499, Korea;
              INTRODUCTION.
         senescence refers to a state in which normal cells arrest growing due to various internal and external stresses. It is caused by stimuli such as DNA damage,
         oncogene activation, and telomere shortening, and is known to serve as a barrier in the tumorigenesis. These phenomenon is characterized by the expression of
         CDK inhibitors (p16INK4A, p21, p53), senescence associated galactosidase(SA-al-gal) staining, and senescence associated secretory protein(SASP). However,
         senescence can also occur in cancer cells that are immortal and grow abnormally, and is observed in cancer patients who have undergone chemical and
         radioactive chemotherapy. This is referred to as therapy induced senescence(TIS), senescent cancer cells have been reported to affect cancel metastasis,
         invocation, immune cell infiltration, and tumor environment, which can exacerbate the prognosis of cancer patients. Cancer stem cells (CSCs) are a small group of
         tumor populations with the ability to tumor initiation and recurrence, which express marker proteins specifically represented by differentiated cells and stem cells,
         such as CD24, CD44, CD133, EpCAM. Stemness refers to the molecular process that appears in stem cells that produce self-renewal ability and differentiated
         daughter cells. In cancer stem cells, the ability to stem cells and resistance to chemotherapy lead to cause recurrence of cancer. For this reason, in chemical
         therapy, a treatment capable of inhibiting cancer stem cells together is required. Herein, we show that therapy induced senescence (TIS) with Doxorubicin in
         various cancer cell line and expression of SASP and stem cell marker in breast cancer cell line. In a recent study, the difference in expression of SASP and CDKi
         according to aging level was shown. Similarly, the grade of senescence in doxorubicin treated breast cancer cell differed senescence phenotypes not stem cell
         related genes. High grade senescent cancer cells were highly expressed SASP, but not stem cell related genes. Conversely, Low grade senescent cancer cells
         increased the expression of stem cell related genes, which can initiate tumor formation. In this study, it is suggested that chemotherapy induces senescence in
         cancer patients, but differences in the grade of senescence can be found, and the resulting characteristics can also be expressed differently.

               RESULTS.
          MCF-7           MDA-MB-231                                                               C12FDG LOW
                                          T47D                          2day     2day    3day
            CON    DOX 150nM  CON  DOX 150nM  CON  DOX 100nM                                       C12FDG MED
                                                                                                   C12FDG MEDHIGH
                                                                   CON:3x10 5 cells  Doxorubicin  M/C  C12FDG staining
                                                                   DOX:6x10 5 cells  100nM, 150nM  FACS  C12FDG HIGH
                                                              CON                      DOX 150nM
                                                                           Population  %             Population  %
                                                                           C12FDG L  98.1            C12FDG L  26.1
                                                                           C12FDG M  1.1             C12FDG M  21.8
                                                                          C12FDG MH  0.1            C12FDG MH  20.4
          SW480           MKN-1           U2OS                             C12FDG H  0.0             C12FDG H  20.2
            CON    DOX 100nM  CON  Cisplatin 1μM  CON  Cisplatin 5μM
                                                                20                CON      50 40           CON
                                                               Relative mRNA expression level  10 5  DOX 150nM  Relative mRNA expression level  30 20  DOX 150nM
                                                                15
                                                                                                           C12FDG L
                                                                                  C12FDG L
                                                                                                           C12FDG M
                                                                                  C12FDG M
                                                                                                           C12FDG MH
                                                                                  C12FDG MH
                                                                0                 C12FDG H  10 0           C12FDG H
                                                                   p21  IL-6  IL-8           OCT3/4  SOX2  NANOG
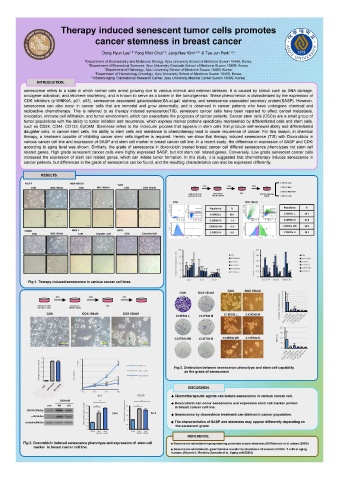
           Fig 1. Therapy-induced senescence in various cancer cell lines.
                                                                                 CON   DOX 150nM
                                                                CON    DOX 150nM                    9 8
                                                                                                   Number of colonies(x100)  2
                     2day       2day        3day                                                    7 6 5
              CON:4x10 4 cells  Doxorubicin  M/C                                                    4 3
              DOX:8x10 4 cells  100nM, 150nM                                                        1
                 CON          DOX 100nM     DOX 150nM                           C12FDG L  C12FDG M  0
                                                               C12FDG L  C12FDG M
                                                                                                   20
                                                                                                   15
                                                              C12FDG MH  C12FDG H  C12FDG MH  C12FDG H  MFE(%)  10
                      200μm          200μm         200μm                                            5
                                                                                                    0
               50
                             5
               SA-b-gal positive cells(% )  30 20  Cell numbers  4 3  DOX con  Fig 3. Distinction between senescence phenotype and stem cell capability
                            x 10000
               40
                                                                  as the grade of senescence
                                                  Dox 100nM
                0 10         2                    DOX 150nM
                             1
                                                                   DISCUSSION.
                             0
                             0day  2day  4day  6day
                                   p16           CD133       ◆ Chemotherapeutic agents can induce senescence in various cancer cell.
                      DOX(nM)       **             *         ◆ Doxorubicin can occur senescence and expresses stem cell marker protein
                               Relative mRNA expression level  2.5  N=4  N=4  ◆ Senescence by doxorubicin treatment can distinct in cancer population.
                  con  100  150  3.5  **     2.5  *           in breast cancer cell line.
          CD133(133kDa)        3             Relative mRNA expression level  2
            p16(16kDa)         1.5 2         1.5
          α-tubulin(54kDa)     1              1              ◆ The characteristics of SASP and stemness may appear differently depending on
                               0.5           0.5               the senescent grade
                               0              0
                                 CON  Dox  Dox  CON  Dox  Dox
                                   100nM 150nM   100nM 150nM
                                                                   REFERENCE.
         Fig 2. Doxorubicin induced senescence phenotype and expression of  stem cell   ◆ Senescence-associated reprogramming promotes cancer stemness.(M Milanovic et al. nature (2018))
             marker  in breast cancer cell line.
                                                             ◆ Senescence-associated β- galactosidase reveals the abundance of senescent CD8+ T cells in aging
                                                             humans. (Ricardo I. Martinez-Zamudio et al. Aging cell(2020))

