


Page 55 - ebook
P. 55
A-27            Phospholipase Cγ1 represses colorectal cancer growth

                         by inhibiting the Wnt/β-catenin signaling axis
                                              Hyun-Jun Jang
      Department of Biological Sciences, Ulsan National Institute of Science and Technology (UNIST), Ulsan, 44919,
                                               Republic of Korea
  Abstract
  As essential phospholipid signaling regulators, phospholipase C (PLC)s are activated by various extracellular ligands and mediate intracellular signal
  transduction. PLCγ1 is involved in regulating various cancer cell functions. However, the precise in vivo link between PLCγ1 and cancer behavior remains
  undefined. To investigate the role of PLCγ1 in colorectal carcinogenesis, we generated an intestinal tissue-specific Plcg1 knock out (KO) in adenomatous
  polyposis coli (Apc) Min/+ mice. Plcg1 deficiency in ApcMin/+ mice showed earlier death, with a higher colorectal tumor incidence in both number and size than
  in wild-type mice. Mechanistically, inhibition of PLCγ1 increased the levels of its substrate phosphoinositol 4,5-bisphosphate (PIP2) at the plasma membrane
  and promoted the activation of Wnt receptor low-density lipoprotein receptor-related protein 6 (LRP6) by glycogen synthase kinase 3β (GSK3β) to enhance β-
  catenin signaling. Enhanced cell proliferation and Wnt/β-catenin signaling were observed in colon tumors from Plcg1 KO mice. Furthermore, low PLCγ1
  expression was associated with a poor prognosis of colon cancer patients. Collectively, we demonstrated the role of PLCγ1 in vivo as a tumor suppressor
  relationship between the regulation of the PIP2 level and Wnt/β-catenin-dependent intestinal tumor formation.the National Research Foundation of Korea (NRF)
  grant funded by the Korea government (2020R1I1A1A01074940)
  Results


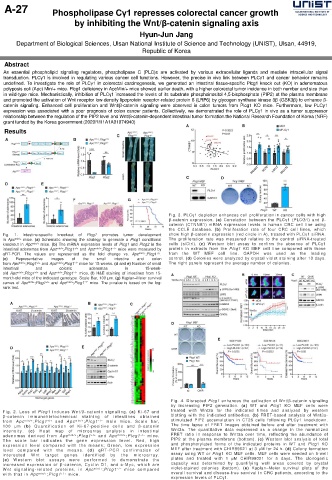
                                                        Fig. 3. PLCγ1 depletion enhances cell proliferation in cancer cells with high
                                                        β-catenin expression. (a) Correlation between the PLCγ1 (PLCG1) and β-
                                                        catenin (CTNNB1) mRNA expression levels in human CRC cell line using
                                                        the CCLE database. (b) Proliferation rate of four CRC cell lines, which
  Fig.  1.  Intestine-specific  knockout  of  Plcg1  promotes  tumor  development  show high β-catenin expression (red circle in A), treated with PLCγ1 siRNA.
  in Apc min/+ mice. (a) Schematic showing the strategy to generate a Plcg1 conditional  The proliferation rate was measured relative to the control siRNA-treated
  knockout in Apc min/+ mice. (b) The mRNA expression levels of Plcg1 and Plcg2 in the  cells (siCtrl). (c) Western blot assay to confirm the absence of PLCγ1
  intestinal adenomas from Apc min/+ ;Plcg1 +/+ and Apc min/+ ;Plcg1 −/− mice were measured by  protein in extracts from the Plcg1 KO MEF cell line compared with those
  qRT-PCR. The values are represented as the fold change vs. Apc min/+ ;Plcg1 +/+ .  from  the  WT  MEF  cell  line.  GAPDH  was  used  as  the  loading
  (c)  Representative  images  of  the  small  intestine  and  colon  control. (d) Colonies were analyzed by crystal violet staining after 10 days.
  from Apc min/+ ;Plcg1 +/+ and Apc min/+ ;Plcg1 −/− mice for 15 weeks. (d and e) Number of small  The right panels represent the average number of colonies.
  intestinal  and   colonic   adenomas    in    15-week-
  old Apc min/+ ;Plcg1 +/+ and Apc min/+ ;Plcg1 −/− mice. (f) H&E staining of intestines from 15-
  month-old mice of the indicated genotype. Scale Bar, 100 μm. (g) Kaplan–Meier survival
  curves of Apc min/+ ;Plcg1 +/+ and Apc min/+ ;Plcg1 −/− mice. The p-value is based on the log-
  rank test.


                                                         Fig. 4. Disrupted Plcg1 enhances the activation of Wnt/β-catenin signaling
                                                         by increasing PIP2 generation. (a) WT and Plcg1 KO MEF cells were
  Fi g. 2. Loss of Plcg 1 i nduces W nt/β-cateni n signali ng. (a) Ki-67 and  treated with Wnt3a for the indicated times and analyzed by western
  β-cateni n  immuno histochemi cal  stai ni ng  of  i ntesti nes  obtai ned  blotting with the indicated antibodies. (b) FRET-based analysis of Wnt3a-
  from Apc m in/+ ;Plcg 1 +/+ and Apc m in/+ ;Plcg1 − /− mal e mi c e. Scal e bar,  stimulated PIP2 accumulation in CT26 cells following PLCγ1 knockdown.
  100 μm (b) Quantifi cati on of Ki-67-positive cell s and β-cateni n  The time lapse of FRET images obtained before and after treatment with
  i ntensity .  (c)  Heat  map  of  microarray  anal ysi s  i n  i ntesti nal  Wnt3a. The quantitative data expressed as a change in the normalized
  adenomas derived from Apc m in/+ ;Plcg 1 +/+ and Apc m in/+ ;Plcg1 −/− mice.  FRET ratio in response to Wnt3a over time, reflecting the abundance of
  The  scal e  bar  i ndi cates  the  gene  expression  l ev el.  Red,  high  PIP2 at the plasma membrane (bottom). (c) Western blot analysis of total
  expressi on l evel compared with the means; Green, l ow expression  and phosphorylated forms of the indicated proteins in WT and Plcg1 KO
  level  compared  with  the  means.  (d)  qRT-PCR  confi rmation  of  MEF after treatment with CHIR99021 at 3 μM for 24 h. (d) Colony formation
  i nterested  W nt  target  genes  identifi ed  by  the  mi croarray.  assay using WT or Plcg1 KO MEF cells. MEF cells were seeded on 6-well
  (e)  W estern  bl ot  assays  were  performed  to  demonstrate  the  plates and treated with 1 μM CHIR99021 for 5 days. The clonogenic
  i ncreased expressi on of β -cateni n, Cycli n D1, and c -Myc, whi ch are  capacity was determined by quantifying well areas covered by crystal
  W nt signali ng -rel ated protei ns, i n Apc m in/+ ;Plcg1 − /− mi ce compared  violet-stained colonies (bottom). (e) Kaplan–Meier survival plots of the
  with that in Apc m in/+ ;Plcg1 + /+ mice.              overall survival and disease-free survival in CRC patients, according to the
                                                         expression levels of PLCγ1.

