
Page 31 - N. Metabolism and metabolic diseases
P. 31
Lipid metabolic dysfunction
in mice with DSS-induced ulcerative colitis
Jeonghyeon Kwon, Chungho Lee, Sungbaek Heo, Chanmi So, Yerin Kim, and Chang-Kee Hyun*
School of Life Science, Handong Global University, Pohang, Republic of Korea
BACKGROUND AIM
Recent studies have shown that there are interactions between IBD and metabolic In this study, we explored the mechanisms driving the
disorders, and that their pathology shares common features, including metabolic development of NAFLD in DSS-induced colitis model
tissue dysregulation, inadequate immune response, and inflammation. However, the mice, which displayed significantly increased hepatic
causal relationship between the two groups of disorders is still unclear. Non-alcoholic steatosis associated with dyslipidemia compared with
fatty liver diseases (NAFLD) is a frequently reported comorbidity in patients with IBD. non-colitis control mice. Our findings provide a
Several studies have suggested that risk factors developing NAFLD might be related potential molecular mechanism that links IBD to lipid
to IBD-related factors such as inflammatory activity, disease duration, previous metabolic dysfunction and hepatic steatosis
intestinal surgery, and prolonged use of IBD therapeutics such as steroids and
immunosuppressants. The pathogenesis of NAFLD involves a complex interaction of
metabolic regulators such as SIRT1, FGF21, adiponectin, and irisin. They play
important roles in glucose and lipid metabolism and energy homeostasis.
Dysregulation of bile acid homeostasis also increased the risk for the development of
chronic inflammatory metabolic diseases such as diabetes, obesity, NAFLD, and IBD.
METHODS
• C57BL/6 mice (8-weeks-old) were randomly-assigned into a water or DSS groups. For chronic colitis model, the DSS groups received water
with 1%, 2%, or 3% w/v DSS mixed into autoclaved water for 7 days, followed by 7 days of purified water. This defied one DSS cycle and
repeated 3 times.
• Disease activity index (DAI) was recorded everyday by scoring the extent of body weight loss, stool consistency, and blood in the stools.
Ø Body weight loss was scored as follows: score 0, no body weight loss; score 1, body weight loss within 1%–5%; score 2, body weight loss within 5%–10%; score 3, body weight loss within 10%–20%; score 4, greater than 20%
body weight loss. Stool consistency was determined as follows: score 0, solid pellets; score 2, loose stool; score 4, diarrhea. Bloody stool was determined ad follows: score 0, no sign of blood; score 2, hemoccult positive; score
4, rectal bleeding.
• H&E stained colon swiss-roll sections were analyzed for severity of colonic inflammation.
Ø Scoring parameters were inflammatory cell infiltrate, epithelial and mucosal damage
RESULTS
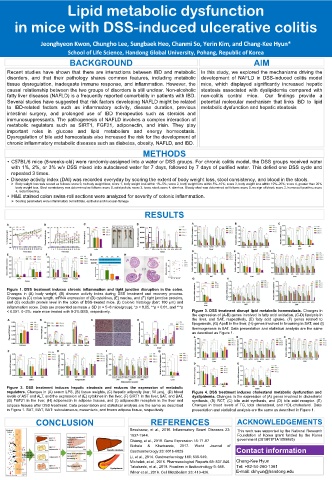
Figure 1. DSS treatment induces chronic inflammation and tight junction disruption in the colon.
Changes in (A) body weight, (B) disease activity index during DSS treatment and recovery process.
Changes in (C) colon length, mRNA expression of (D) cytokines, (E) mucins, and (F) tight junction proteins,
and (G) occludin protein level in the colon of DSS-treated mice. (I) Colonic histology (bar; 100 µm) and
inflammation score. Data are presented as mean ± SD (n = 5~8 mice/group); *p < 0.05, **p < 0.01, and ***p
< 0.001. 0~3%: male mice treated with 0-3% DSS, respectively. Figure 3. DSS treatment disrupt lipid metabolic homeostasis. Changes in
the expression of (A-B) genes involved in fatty acid oxidation, (C-D) lipolysis in
the liver, and SAT, respectively, (E) fatty acid uptake, (F) genes related to
lipogenesis, (G) ApoB in the liver, (H) genes involved in browning in SAT, and (I)
thermogenesis in BAT. Data presentation and statistical analysis are the same
as described as Figure 1.
Figure 2. DSS treatment induces hepatic steatosis and reduces the expression of metabolic
regulators. Changes in (A) serum LPS, (B) tissue weights, (C) hepatic adiposity (bar; 50 µm), (D) blood Figure 4. DSS treatment induces cholesterol metabolic dysfunction and
levels of AST and ALT, and the expression of (E) cytokines in the liver, (F) SIRT1 in the liver, SAT, and BAT, dyslipidemia. Changes in the expression of (A) genes involved in cholesterol
(G) FGF21 in the liver, (H) adiponectin in adipose tissues, and (I) adiponectin receptors in the liver and synthesis, (B) RCT, (C) bile acid synthesis, and (D) bile acid receptor. (E)
adipose tissues after DSS treatment. Data presentation and statistical analysis are the same as described Changes in blood levels of TG, total cholesterol, and HDL-cholesterol. Data
in Figure 1. SAT, MAT, BAT: subcutaneous, mesenteric, and brown adipose tissue, respectively. presentation and statistical analysis are the same as described in Figure 1.
CONCLUSION REFERENCES ACKNOWLEDGEMENTS
Bessissow, et al., 2016. Inflammatory Bowel Diseases 22: This work was supported by the National Research
1937-1944. Foundation of Korea grant funded by the Korea
Chiang, et al., 2018. Gene Expression 18: 71-87 government (2019R1F1A1059860)
Eichele & Kharbanda, 2017. World Journal of
Gastroenterology 23: 6016-6029 Contact information
Li, et al., 2014. Gastroenterology 146: 539-549.
Michalak, et al., 2016. Pharmacological Reports 68: 837-846. Chang-Kee Hyun
Takahashi, et al., 2018. Frontiers in Endocrinology 9: 588. Tel: +82-54-260-1361
Winer et al., 2016. Cell Metabolism 23: 413-426. E-mail: ckhyun@handong.edu