
Page 9 - M. Immunology
P. 9
Levels of Pulmonary Cytokines after Sub-Acute Inhalation Study of
Graphene Nanoplatelets
1
Jae Hoon Shin , Jin Kwon Kim , JinEe Baek , Jong Seong Lee , Kangho Ahn , Il Je Yu 3
1
2
2
1
1 Institute of Occupation & Environment, KCOMWEL, Incheon, Republic of Korea
2 Department of Mechanical Engineering, Hanyang Univierity, Ansan, Republic of Korea
3 Research Center, HCTm, Icheon, Republic of Korea
Introduction Figure 2. Analysis of graphene oxide with
FE-TEM (×100,000), EDS-spectrometer.
• Graphene has recently been attracting increasing attention to its unique
electronic and chemical properties and many potential applications in such
fields as semiconductors, energy storage, flexible electronics, biosensors,
and medical imaging. However, the toxicity of graphene in the case of
human exposure has not yet been clarified.
• Thus, 28-days (6 hr/day, 5 days/week, 4 weeks) repeated inhalation
toxicity study of graphene was conducted using a nose-only inhalation
system for male Sprague-Dawley (SD) rats. The resulting toxicity • No statistically significant difference was observed in the levels of
information will provide the necessary data for a safety evaluation of the pulmonary cytokines, such as TNF-alpha between the exposed and
graphene used in this study. control groups after 28-days repeated inhalation exposure of graphene
and during the recovery periods.
Materials and Methods BALF cytokines
Unit: pg/mg/lung (mean ± SE)
• The graphene (GPX-205; average lateral dimension, < 2 um; surface area,
750 m /g) was provided by Cabot Corporation (Boston, Massachusetts, Group Control Low Middle High
2
USA). The graphene was analyzed by Field emission-transmission Exposed 28-
day
electron microscope (FE-TEM, JEM2100F, JEOL, Japan) and energy- TNF-a 15.36 ± 8.14 (5) 18.78 ± 6.18 (5) 16.29 ± 4.36 (5) 7.18 ± 0.93 (5)
1
a
2
dispersive X-ray spectrometer (EDS, TM200, Oxford, UK). IL-18 10.48 ± 1.55 (5) 17.32 ± 3.13 (5) 31.70 ± 6.20 (5) 11.54 ± 3.67 (5)
3
VEGF 25.75 ± 5.22 (5) 26.04 ± 3.94 (5) 29.24 ± 5.89 (5) 11.86 ± 3.59 (5)
• The SD rats were exposed to the graphene using a nose-only exposure TGF-b1 47.06 ± 11.38 (5) 39.05 ± 14.82 (5) 40.69 ± 7.79 (5) 39.23 ± 12.19 (5)
4
system (HCT, Icheon, Korea) (Figure 1). Total of four groups (15 rats per Recovery 28-
group) were compared: (1) control (High-efficiency particulate air days
1
(HEPA)-filtered clean air), (2) low-concentration (0.12 ± 0.00 mg/m ), (3) TNF-a 14.37 ± 4.03 (5) 13.54 ± 1.57 (5) 10.54 ± 3.44 (4) 14.08 ± 4.23 (5)
3
b
2
IL-18
6.48
middle-concentration (0.47 ± 0.03 mg/m ), and (4) high- concentration VEGF 10.78 ± 3.68 (5) 24.92 ± 2.09 (5) 10.08 ± 1.08 (4) 16.45 ± 1.24 (5)
3
(4)
(5)
(5)
±
(5)
±
±
±
3
5.70
24.78
5.84
3.97
31.32
25.73
2.63
(1.88 ± 0.18 mg/m ). The SD rats were followed by recovery period for 1, TGF-b 52.99 ± 7.32 (5) 48.06 ± 13.54 (5) 33.64 ± 8.90 (4) 35.65 ± 11.10 (5)
3
4
28, and 90 days after exposure to graphene.
Recovery 90-
days
1
TNF-a 21.31 ± 2.77 (5) 10.01 ± 2.67 (5) 5.45 ± 1.16 (5) 16.33 ± 8.29 (5)
2
IL-18 4.73 ± 1.15 (5) 3.71 ± 1.64 (5) 2.25 ± 0.58 (5) 3.09 ± 0.43 (5)
c
3
VEGF 37.87 ± 5.83 (5) 21.77 ± 4.99 (5) 17.76 ± 4.40 (5) 21.98 ± 4.52 (5)
4
TGF-b1 23.06 ± 13.98 (5) 30.16 ± 10.66 (5) 30.50 ± 5.76 (5) 25.84 ± 6.91 (5)
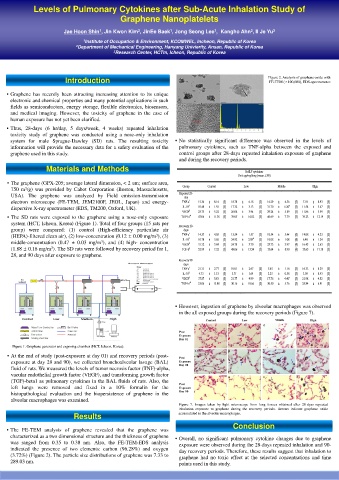
• However, ingestion of graphene by alveolar macrophages was observed
in the all exposed groups during the recovery periods (Figure 7).
Figure 1. Graphene generator and exposing chamber (HCT, Icheon, Korea).
• At the end of study (post-exposure at day 01) and recovery periods (post-
exposure at day 28 and 90), we collected bronchoalveolar lavage (BAL)
fluid of rats. We measured the levels of tumor necrosis factor (TNF)-alpha,
vacular endothelial growth factor (VEGF), and transforming growth factor
(TGF)-beta1 as pulmonary cytokines in the BAL fluids of rats. Also, the
left lungs were removed and fixed in a 10% formalin for the
histopathological evaluation and the biopersistence of graphene in the
alveolar macrophages was examined.
Figure 7. Images taken by light microscope from lung tissues obtained after 28-dyas repeated
inhalation exposure to graphene during the recovery periods. Arrows indicate graphene oxide
Results accumulated in the alveolar macrophages.
Conclusion
• The FE-TEM analysis of graphene revealed that the graphene was
characterized as a two dimensional structure and the thickness of graphene • Overall, no significant pulmonary cytokine changes due to graphene
was ranged from 0.35 to 0.38 nm. Also, the FE-TEM-EDS analysis exposure were observed during the 28-days repeated inhalation and 90-
indicated the presence of two elements: carbon (96.28%) and oxygen day recovery periods. Therefore, these results suggest that inhalation to
(3.72%) (Figure 2). The particle size distributions of graphene was 7.33 to graphene had no toxic effect at the selected concentrations and time
289.03 nm. points used in this study.