Page 23 - M. Immunology
P. 23

TIGIT blockade enhances T cell activation


                                                                                                                  via tyrosine phosphorylation of CD226


                                                                                                                                                                                                                                                                                                                                                                      3
                                                                                                                                                                                                                                                                                                                                                                                                                                                 2
                                                                                                                                                                                                                                                                                                                                                                                                                                                                                                         1
                                                                                                                                                                                                                                                                                                  2
                                                                                              1
                                                                                                                                                          2
                                                                                                                                                                                                                                  1
                                         Minkyung Ko , Da-som Choi , June Hyuck Kim , Dong-hee Lee , Hyun Kyu Song , Hyung-seung Jin ,*, Yoon Park ,*
                            1   Asan Institute for Life science, Asan Medical Center (AMC), Seoul, Republic of Korea


                            2   Biomedical Research Institute, Korea Institute of Science and Technology (KIST), Seoul, Republic of Korea


                            3   Department of Life Sciences, Korea University, 145 Anam-ro, Seongbuk-gu, Seoul 02841, Republic of Korea


                            * Corresponding author


                                                                                                                                                                                                                                                 ABSTRACT


                    Multiple clinical trials are evaluating the efficacy of anti-TIGIT antibodies for use as single-agent therapy or in combination with PD-1/PD-L1 blockade.


                  However, TIGIT’s mechanism of action and whether a TIGIT blockade will synergize with current immunotherapies is not fully understood. Here we show that


                                                        +
                                                                                                                                                                                                                                                                                                                                                                                                                                                                                                               +
                                                                                                                                                                                                                                                                                                                                                                                                                                                                                              hi
                                       lo
                  CD226 CD8 T cells are accumulated at the tumor site and have an exhausted phenotype with an impaired functionality. In contrast, CD226 CD8 tumor-
                                                                                                                                                                                                                                                                                                                                                                                                                                                                                       hi
                                                                                                                                                                                                                                                                                                                                                                                                                                                                                                        +
                  infiltrating T cells possess a higher self-renewal capacity and potent responsiveness. Anti-TIGIT antibody treatment selectively affects CD226 CD8 T cells by


                                                                                                                                                                                                                                                                                                                                                                                                                                                                                                                                  +
                  promoting CD226 phosphorylation at tyrosine 322. CD226 agonist antibody-mediated activation of CD226 augments the effect of TIGIT blockade on CD8 T


                                                                                                                                                                                                                                                                                                                                                                                                                                                                       +
                                                                                                                                                                                                                                                                                                                                                                                                                                                      hi
                  cell responses. Our results implicate CD226 as a predictive biomarker for cancer immunotherapy and suggest that increasing CD226 CD8 T cells may improve


                  anti-TIGIT therapy.


                                                                                                                                                                                                                                                       RESULTS


                                                                                                                                                                                                                                                                                                                                                                                                                                                                        lo
                                                                                                                                                                                                                                                                                                                                                                                                                                                                                         +
                                                                                                                                          +
                   Figure 1. Expression of CD226 on CD8 T cells within mouse and human tumors.                                                                                                                                                                                                                          Figure 2. Phenotypic characteristics of CD226 CD8 TILs.


                                                                                                                                                +
                                                                                                                         +
                    A) Flow cytometric analysis of CD226 expression in total CD44 memory CD8 T cells from the spleens (SP) and tumors of mice bearing 4T1, B16F10, CT26,
                                                                                                                                                     lo
                                                                                                                                                               +
                                                                                                                                                                       +
                    and MC38 tumors and a summary plot showing the percentages of CD226 CD44 CD8 T cells.                                                                                  B) Summary graph showing the geometric mean
                                                                                                                                                                                                                                                                                                                                                                                                +
                                                                                                                                                                                                                                                                                                                                                                                                                   +
                                                                                                                                                                                                                                                                                                                                                                                                          -
                                                                                                                                                                                                                                                                                                                                                                                                                                                                                                +
                                                                                                                                +
                                                                                                                                                       +
                                                                                                                     hi
                    fluorescence intensity (MFI) of CD226 expression on CD226 CD44 memory CD8 T cells in the mouse SP and tumors as in A. C) Flow cytometric analysis                                                                                                                       A) Expression of co-inhibitory receptors in human CD45RA CCR7 CD8 TILs. Representative t-SNE plots of RCC CD8 TILs overlaid with the
                                                                                                                                                                                                                                                                                                                                                                                                                                                                                                                lo
                                                                                            +
                                                                                                                   -
                                                                                                                                                +
                                                                                                                                 +
                    of CD226 expression in human memory CD8 T cells (CCR7 CD45RA CD45RO ) isolated from tumors and normal tissues of cancer patients and a summary                                                                                                                          expression of indicated surface receptors. Summary graph showing the MFI of co-inhibitory receptor expressions in CD226 and CD226                                                                                                         hi
                                                                                                                                                                                                                                                                                                                                                                                                                                             lo
                                                                                                                                                                                                                                                                                                                                                                                                                                                                             +
                                                                                                                                                                                                                                                                                                                   -
                                                                                                                                                                                                                                                                                                          +
                                                                                                                                                                                                                                                                                                                                                                                                                                                                   hi
                                                                                                                                                                                                                                                                                                                           +
                                                                                      lo
                                                                                                               +
                    plot showing the percentages of CD226 memory CD8 T cells. RCC (renal cell carcinoma) patients’ normal and tumor tissues; CRC (colorectal cancer)                                                                                                                        CD45RA CCR7 CD8 TILs from cancer patients. B) Representative t-SNE plots of CD226 and CD226 CD8 T cells within 4T1 tumors in mice.
                                                                                                                                                                                                                                                                                                                                                            lo
                                                                                                                                                                                                                                                                                                                                                                                  hi
                                                                                                                                                                                                                                                                                                                                                                                            +
                    patients’ normal and tumor tissues; NSCLC (non-small-cell lung carcinoma) patients’ normal and tumor tissues.                                                                                       D) Summary graph showing the                                        C) Flow cytometric analysis of CD226 and CD226 CD8 memory T cells isolated from 4T1 tumors in mice. Summary graph showing the
                                                                                                                                                                                                                                                                                                                                                                                                      +
                                                                                                                                                                                                                                                                                                                                                                                              +
                                                                                                                         +
                    geometric MFI of CD226 expression on human memory CD8 T cells in normal and tumor tissues as in C. Each dot represents an individual mouse or                                                                                                                           percentages of the indicated marker expressions on CD44 CD8 TILs in 4T1 tumors. D) Summary graph showing the geometric MFI of the
                                                                                                                                                                                                                                                                                                                                                           +
                                                                                                                                                                                                                                                                                                                                                                  +
                    human sample.                                                                                                                                                                                                                                                           indicated marker expressions on CD44 CD8 TILs in 4T1 tumors.
                                                                                                                                                                                                                                                                                                                                                                                          +
                             Figure 3. CD26 downregulation is associated with T-cell dysfunction.                                                                                                                                                                            Figure 4. CD226 expression in CD8 T cells is required for anti-TIGIT responses.


                                                                                                                                                                                                                                                                                                                                                                                                                                                                                               +
                                                                                                                                                                                                                                                                                                                                                                                                                                                                                      hi
                                                                                                                                                                                                                                                                                                                                +
                                                                                                                                                                                                                                                                                                                                                                                                                                                                lo
                                                                                                                                                                                                                                                                           (A and B) Peripheral blood CD8 T                          em   cells were FACS-sorted based on CD226 expression. The sorted CD226 and CD226 CD8 T                                                                       em   cells were cultured
                                                                                                                                                                                                                                                                           separately and stimulated with CEF peptide pool in the presence of anti-TIGIT and/or anti-PD-1. A) Flow cytometric analysis showing CTV dilution of
                                                                                                                                                                                                                                                                                     lo
                                                                                                                                                                                                                                                                                                           hi
                                                                                                                                                                                                                                                                                                                    +
                                                                                                                                                                                                                                                                                                                                                                                                                                                         hi
                                                                                                                                                                                                                                                                                                                                                                                                                                    lo
                                                                                                                                                                                                                                                                                                                                                                                                                                                                   +
                                                                                                                                                                                                                                                                           CD226 and CD226 CD8 T                         em  cells. Summary plot showing the percentages of CTV                                     low  CD226 and CD226 CD8 T cells. B) ELISA of IFN                                            production by
                                                                                                                                                                                                                                                                                                          hi
                                                                                                                                                                                                                                                                                     lo
                                                                                                                                                                                                                                                                                                                    +
                                                                                                                                                                                                                                                                           CD226 and CD226 CD8 T cells. Data are pooled from three independent experiments.
                                                                                                                                                                                                                                                                                                                       em
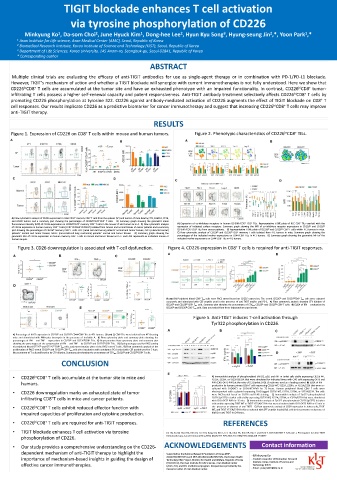
                                                                                                                                                                                                                                                                                                                      Figure 5. Anti-TIGIT induces T-cell activation through


                                                                                                                                                                                                                                                                                                                                                   Tyr322 phosphorylation in CD226.


                                                                                                                                                                                                +
                                                                                                                  hi
                                                                                             lo
                                                                                                                                      +
                                                                                                                              +
                      A) Percentage of Ki-67 expression in CD226 and CD226 CD44 CD8 TILs in 4T1 tumors. (B and C) CD8 TILs were isolated from 4T1 bearing
                      mice and stimulated with PMA plus ionomycin in the presence of brefeldin A. B) Flow cytometry plots and summary plots showing the
                                                                                                                                                +
                                                                                                                                       hi
                                                                                                                 lo
                      percentages of IFN                   and TNF            expressions in CD226 and CD226 CD8 TILs. C) Representative flow cytometry plots and summary plot
                                                                                                                                                                                +
                                                                                                                                                                       hi
                                                                                                                                                  lo
                      showing the percentages of the coexpression of IFN                                        and TNF           by CD226 and CD226 CD8 TILs. D) Gating strategy used for FACS sorting
                                                                 lo
                                                                                               +
                                                                                      hi
                      of peripheral blood CD226 and CD226 CD8 T                                    em   cells, and representative plots of the FACS-sorted T cells. E) Flow cytometric analysis of the
                                                                                                             +
                                                                               lo
                                                                                                    hi
                      proliferation of FACS-sorted CD226 and CD226 CD8 T                                         em   cells after incubation with autologous DCs loaded with CEF peptide pool for 5 days.
                                                                                                                                                                                                                                    +
                                                                                                                                                                                                      lo
                                                                                                                                                                                                                           hi
                      Measurement of T-cell proliferation by CTV dilution. Summary plot showing the percentages of CTV                                                                 low  CD226 and CD226 CD8 T cells.
                                                                                                   CONCLUSION


                      •            CD226 CD8 T cells accumulate at the tumor site in mice and                                                                                                                                                                                                                                                       A) Immunoblot analysis of phosphorylated ERK1/2, p38, and AKT in Jurkat cells stably expressing CD226 WT,
                                                                          +
                                                        lo
                                                                                                                                                                                                                                                                                                                                                    Y322A, S329A, or Y322A/S329A that were stimulated for indicated times with CHO cells expressing OKT3 and

                                   humans.                                                                                                                                                                                                                                                                                                          PVR (CHO-OKT3-PVR) at the ratio of 5:1 (Jurkat:CHO). β-actin was used as a loading control. B) ELISA of IFN

                                                                                                                                                                                                                                                                                                                                                    production by human primary CD8+ T cells expressing CD226 WT, Y322A, S329A, or Y322A/S329 that were co-

                                                                                                                                                                                                                                                                                                                                                                                                                                                                                                              +
                                                                                                                                                                                                                                                                                                                                                    cultured with CHOOKT3 or CHO-OKT3-PVR for 72 hours. Human peripheral blood CD8 T cells were
                      •            CD226 downregulation marks an exhausted state of tumor                                                                                                                                                                                                                                                           electroporated with a plasmid expressing FLAG-tagged CD226 WT, Y322A, S329A, or Y322A/S329. The cells


                                                                                                                                                                                                                                                                                                                                                    were FACS-sorted based on CD226 and FLAG staining.                                              C) Immunoblot analysis of Tyr322 phosphorylated

                                                                                    +
                                   infiltrating CD8 T cells in mice and cancer patients.                                                                                                                                                                                                                                                            CD226 (pY322) in Jurkat cells stably expressing CD226 WT, Y322A, S329A, or Y322A/S329 that were stimulated
                                                                                                                                                                                                                                                                                                                                                    with CHO-OKT3-PVR for 15 min. D) Immunoblot analysis of Tyr322 phosphorylated CD226 (pY322) in Jurkat

                                                                                                                                                                                                                                                                                                                                                    cells stably expressing TIGIT WT or TIGIT Y225A/Y231A that were stimulated with CHO-OKT3-PVR for 15 min in
                      •            CD226 CD8 T cells exhibit reduced effector function with                                                                                                                                                                                                                                                         the presence or absence of anti-TIGIT. E) Flow cytometric analysis of CD69 expression in Jurkat cells, TIGIT
                                                                          +
                                                        lo
                                                                                                                                                                                                                                                                                                                                                    WT, and TIGIT Y225A/Y231A cells co-cultured with SEE peptide-loaded Raji cells in the presence or absence of

                                   impaired capacities of proliferation and cytokine production.                                                                                                                                                                                                                                                    hIgG1 or anti-TIGIT for 24 hours.


                      •            CD226 CD8 T cells are required for anti-TIGIT responses.                                                                                                                                                                                                                                                                           REFERENCES
                                                        hi
                                                                          +


                      •            TIGIT blockade enhances T cell activation via tyrosine                                                                                                                                                                                  Jin HS, Ko M, Choi DS, Kim JH, Lee DH, Kang SH, Kim I, Lee HJ, Choi EK, Kim KP, Yoo C and Park Y. CD226hiCD8+ T Cells Are a Prerequisite for Anti-TIGIT


                                   phosphorylation of CD226.                                                                                                                                                                                                               Immunotherapy. Cancer Immunol Res.2020; (8) (7) 912-925; DOI: 10.1158/2326-6066.CIR-19-0877


                      •            Our study provides a comprehensive understanding on the CD226-                                                                                                                                                                       ACKNOWLEDGEMENTS                                                                                                                                           Contact information


                                   dependent mechanism of anti-TIGIT therapy to highlight the                                                                                                                                                                              Supported by the National Research Foundation of Korea (NRF-                                                                            - Minkyung Ko


                                   importance of mechanism-based insights in guiding the design of                                                                                                                                                                         2016M3A9E8941331 and NRF-2018R1D1A1B07050715), the Korean Health                                                                        - Student researcher of Biomedical  Research
                                                                                                                                                                                                                                                                           Technology R&D Project, Ministry for Health and Welfare, Republic of Korea
                                                                                                                                                                                                                                                                                                                                                                                                                     Institute, Korea  Institute of Science and
                                                                                                                                                                                                                                                                           (HI15C0972), the Asan Institute for Life Sciences, Asan Medical Center
                                   effective cancer immunotherapies.                                                                                                                                                                                                       (2019-763), and KIST institutional program. Biospecimens provided by Bio-                                                                 Technology (KIST)


                                                                                                                                                                                                                                                                                                                                                                                                                   - Email : yuiopmk15@kist.re.kr
                                                                                                                                                                                                                                                                           Resource Center of Asan Medical Center.
   18   19   20   21   22   23   24   25   26   27   28