
Page 79 - D. Cancer biology
P. 79
Wnt-EGFR signaling induces tumor development in part through
Phosphofructokinase 1 platelet isoform upregulation
So Mi Jeon and Jong-Ho Lee
Department of Health Sciences, The Graduate School of Dong-A University, Busan, 49315, Republic of Korea
BACKGROUND AIM
A. Most cancer cells exhibit altered metabolisms, including the Warburg effect; elevated glucose uptake and lactate
production regardless of oxygen levels (1). Activation of Wnt or EGFR signaling is commonly detected in various types of cancer and is
B. The canonical Wnt/β-catenin signaling is involved in altered glucose metabolism, however, it remains unknown associated with development of cancer. In this study, we investigated a molecular basis for
whether the Warburg effect is activated by the non-canonical Wnt signaling in cancer cells (2,3).
metabolic alteration induced by Wnt3A-mediated EGFR transactivation in the EGFR-
C. Wnt signaling activates β-catenin-independent pathways, such as PI3K/AKT (4).
overexpressed cancer cells. Specifically, we uncovered the potential role of PFKP in Wnt
D. In the glycolytic pathway, phosphofructokinase 1 (PFK1) catalyzes the conversion of fructose 6-phosphate and
ATP to fructose-1,6-bisphosphate and ADP, which is one of the key regulatory and rate-limiting steps of
glycolysis (5). signaling-induced tumor development.
E. PFKP is the prominent PFK1 isoform in glioblastoma (GBM) cells and is overexpressed in human GBM
specimens (6).
F. AKT activation resulting from activation of Epidermal growth factor receptor (EGFR) and PI3K or PTEN loss
phosphorylated PFKP at Ser386, which is important for PFKP stability. The PFKP S386 phosphorylation
promoted glycolysis, cell proliferation, and brain tumor growth (7).
METHODS
Cell culture and transfection
Epidermoid carcinoma A431 cells were maintained in Dulbecco’s modified Eagle’s medium (DMEM) supplemented with 10% bovine calf serum (Capricorn Scientific GmbH). Cells were plated at a density of a 6-well plate 18 h before transfection. Transfection was performed using HyFect
transfection reagent (Denville Scientific) according to the manufacturer’s instructions.
Quantitative Real-Time PCR Analysis
Total RNA isolation, reverse transcription (RT), and real-time PCR were conducted as described previously. The following primer pairs were used for quantitative real-time PCR: PFKP, 5′-CGGAAGTTCCTGGAGCACCTCTC- 3′ (forward) and 5′-AAGTACACCTTGGCCCCCACGTA-3′ (reverse);
PFKL, 5′-GGCATTTATGTGGGTGCCAAAGTC-3′ (forward) and 5′-CAGTTGGCCTGCTTGATGTTCTCA-3′ (reverse); PFKM, 5′-GAGTGACTTGTTGAGTGACCTCCAGAAA-3′ (forward) and 5′-CACAATGTTCAGGTAGCTGGACTTCG-3′ (reverse).
Immunoblot Analysis
Extraction of proteins from cultured cells was performed using a lysis buffer (50mM Tris-HCl, [pH 7.5], 0.1% SDS, 1% Triton X-100, 150mM NaCl, 1mM DTT, 0.5mM EDTA, 100µM sodium orthovanadate, 100µM sodium pyrophosphate, 1 mM sodium fluoride, and proteinase inhibitor cocktail). Cell
extracts were clarified via centrifugation at 13,400 g, and the supernatants (2 mg protein/mL) were subjected to immunoblot analysis with corresponding antibodies. Each experiment was repeated at least three times.
Immunofluorescence Analysis
Cells were fixed and incubated with primary antibodies, Alexa Fluor dye-conjugated secondary antibodies, and DAPI according to standard protocols. Cells were examined using a deconvolution microscope (Zeiss, Thornwood, NY) with a 63-A◦ oil-immersion objective. Axio Vision software from
Zeiss was used to deconvolute Z-series images
Measurements of Glucose Consumption and Lactate Production
Cells were seeded in culture dishes, and the medium was changed after 6 h with non-serum DMEM. Cells were incubated for 48 h, and the culture medium was then collected for measurement of glucose and lactate concentrations. Glucose levels were determined by using a glucose (GO) assay
kit (Sigma). Glucose consumption was the difference in glucose concentration between the collected culture medium and DMEM. Lactate levels were determined by using a lactate assay kit (Eton Bioscience, San Diego, CA). All results were normalized to the final cell number.
Colony Formation Assay
A431 cells (1x10 3 cells/well) were cultured in 6well plate. The cells were fixed with 10% formalin and stained with 0.1% crystal violet.
RESULTS
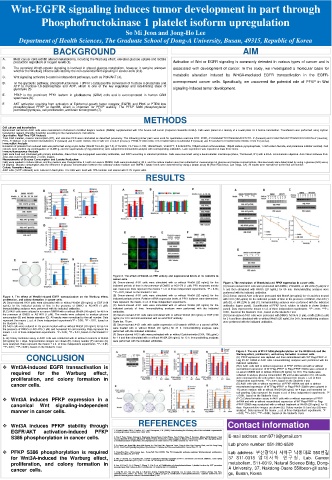
Figure 2. The effect of Wnt3A on PFK activity and expressional levels of its isoforms in
cancer cells.
(A) Serum-starved A431 cells were stimulated with or without Wnt3A (20 ng/mL) for the Figure 3. The mechanism of Wnt3A-induced PFKP expression in cancer cells.
indicated periods of time in the presence of DMSO or AG1478 (1 μM). PFK enzymatic activity (A) Serum-starved A431 cells were pretreated with DMSO, LY294002, or MK-2206 (5 μM) for 2
was measured. Data represent the means ± s.d. of three independent experiments. *P < 0.05; h and then stimulated with Wnt3A (20 ng/mL) for 60 min. Immunoblotting analyses were
**P < 0.01, based on the Student’s t test. performed with the indicated antibodies.
Figure 1. The effect of Wnt3A-induced EGFR transactivation on the Warburg effect, (B) Serum-starved A431 cells were stimulated with or without Wnt3A (20 ng/mL) for the (B,C) Serum-starved A431 cells were pretreated with Wnt3A (20 ng/mL) for 1 h and then treated
proliferation, and colony formation in cancer cells. indicated periods of time. Relative mRNA expression levels of PFK1 isoforms were determined. with CHX (100 ㎍/mL) for the indicated periods of time in the presence of DMSO, AG1478 (1
(A) Serum-starved A431 cells were stimulated with or without Wnt3A (20 ng/mL) or EGF (100 Data represent the means ± s.d. of three independent experiments. μM) (B), or MK-2206 (5 μM) (C). Immunoblotting analyses were performed with the indicated
ng/mL) for the indicated periods of time in the presence of DMSO or AG1478 (1 μM). (C) Serum-starved A431 cells were stimulated with or without Wnt3A (20 ng/mL) for the antibodies (upper panel). Quantification of PFKP levels relative to tubulin is shown (bottom
Immunoblotting analyses were performed with the indicated antibodies. indicated periods of time. Immunoblotting analyses were performed with the indicated panel). Data represent the means ± s.d. of three independent experiments. **P < 0.01; ***P <
(B,C) A431 cells were cultured in no-serum DMEM with or without Wnt3A (20 ng/mL) for 48 h in antibodies. 0.001, based on the Student’s t test., based on the Student’s t test.
the presence of DMSO or AG1478 (1 μM). The media were collected to analyze glucose (D) Serum-starved A431 cells were stimulated with or without Wnt3A (20 ng/mL) or EGF (100 (D) Serum-starved A431 cells were pretreated with DMSO, AG1478 (1 μM), or MK-2206 (5 μM)
consumption (B) and lactate secretion (C). All results were normalized to the cell number. Data ng/mL) for 24 h and immunostained with an anti-PFKP antibody. for 2 h and then stimulated with or without Wnt3A (20 ng/mL) for 24 h. Immunoblotting analyses
represent the means ± s.d. of three independent experiments*P < 0.05; **P < 0.01, based on Scale bar, 10 μm. were performed with the indicated antibodies.
the Student’s t test. (E) Serum-starved A431 cells with stable expression of β-catenin shRNA or a control shRNA
(D) A431 cells were cultured in 1% serum medium with or without Wnt3A (20 ng/mL) for 96 h in
the presence of DMSO or AG1478 (1 μM) and harvested for cell counting. Data represent the were treated with or without Wnt3A (20 ng/mL) for 24 h. Immunoblotting analyses were
means ± s.d. of three independent experiments. *P < 0.05; **P < 0.01, based on the Student’s t performed with the indicated antibodies.
test. (F) Serum-starved A431 cells were pretreated with or without Cycloheximide (CHX; 100 µg/mL)
(E-G) Colony formation assay in A431 cells was conducted with or without treatment of Wnt3A for 1 h and then stimulated with or without Wnt3A (20 ng/mL) for 12 h. Immunoblotting analyses
(20 ng/mL) for 7 days. Representative images are shown (E). Colony number (F) and size (G) were performed with the indicated antibodies.
were analyzed. Data represent the means ± s.d. of three independent experiments. *P < 0.05;
**P < 0.01; ***P < 0.001, based on the Student’s t test.
Figure 4. The role of PFKP S386 phosphorylation on the Wnt3A-induced the Warburg effect, proliferation, and
Figure 4. The role of PFKP S386 phosphorylation on the Wnt3A-induced the
CONCLUSION colony formation in cancer cells. Warburg effect, proliferation, and colony formation in cancer cells.
(A) PFKP expression was depleted and then reconstituted with WT Flag-rPFKP or Flag-rPFKP S386A in A431 cells.
(A) PFKP expression was depleted and then reconstituted with WT Flag-rPFKP or
Flag-rPFKP S386A in A431 cells. Immunoblotting analyses were performed with the
Immunoblotting analyses were performed with the indicated antibodies. indicated antibodies.
Wnt3A-induced EGFR transactivation is (B,C) A431 cells with or without expression of PFKP shRNA and with or without reconstituted expression of WT Flag-
(B,C) A431 cells with or without expression of PFKP shRNA and with or without
reconstituted expression of WT Flag-rPFKP or Flag-rPFKP S386A were cultured in
required for the Warburg effect, rPFKP or Flag-rPFKP S386A were cultured in no-serum DMEM with or without Wnt3A (20 ng/mL) for 48 h. The media
no-serum DMEM with or without Wnt3A (20 ng/mL) for 48 h. The media were
were collected to analyze glucose consumption (B) and lactate secretion (C). All results were normalized to the cell number.
collected to analyze glucose consumption (B) and lactate secretion (C). All results
proliferation, and colony formation in Data represent the means ± s.d. of three independent experiments. **P < 0.01, based on the Student’s t test.
were normalized to the cell number. Data represent the means ± s.d. of three
independent experiments. **P < 0.01, based on the Student’s t test.
cancer cells. (D) A431 cells with or without expression of PFKP shRNA and with or without reconstituted expression of WT Flag-rPFKP
(D) A431 cells with or without expression of PFKP shRNA and with or without
or Flag-rPFKP S386A were cultured in 1% serum medium with or without Wnt3A (20 ng/mL) for 4 days and harvested for
reconstituted expression of WT Flag-rPFKP or Flag-rPFKP S386A were cultured in
1% serum medium with or without Wnt3A (20 ng/mL) for 4 days and harvested for
cell counting. Data represent the means ± s.d. of three independent experiments. *P < 0.001, based on the Student’s t test.
cell counting. Data represent the means ± s.d. of three independent experiments. *P
< 0.001, based on the Student’s t test.
Wnt3A induces PFKP expression in a (E-G) Colony formation assay in A431 cells with or without expression of PFKP shRNA and with or without reconstituted
expression of WT Flag-rPFKP or Flag-rPFKP S386A was conducted with or without treatment of Wnt3A (20 ng/mL) for 12
(E-G) Colony formation assay in A431 cells with or without expression of PFKP
shRNA and with or without reconstituted expression of WT Flag-rPFKP or Flag-
canonical Wnt signaling-independent days. Representative images are shown (E). Colony number (F) and size (G) were analyzed. Data represent the means ± s.d.
rPFKP S386A was conducted with or without treatment of Wnt3A (20 ng/mL) for 12
of three independent experiments. *P < 0.05; **P < 0.01; ***P < 0.001, based on the Student’s t test.
days. Representative images are shown (E). Colony number (F) and size (G) were
manner in cancer cells. analyzed. Data represent the means ± s.d. of three independent experiments. *P
< 0.05; **P < 0.01; ***P < 0.001, based on the Student’s t test.
REFERENCES
Wnt3A induces PFKP stability through Contact information
EGFR/AKT activation-induced PFKP 1. Vander Heiden, M.G., Cantley, L.C., and Thompson, C.B. (2009). Understanding the Warburg effect: the metabolic requirements
of cell proliferation. Science324, 1029-1033.
S386 phosphorylation in cancer cells. 2. Kira T Pate, Chiara Stringari†, Stephanie Sprowl-Tanio, Kehui Wang, Tara TeSlaa, Nate P Hoverter, Miriam M McQuade, Chad E-mail address: somi9719@gmail.com
Garner, Michelle A Digman, Michael A Teitell, Robert A Edwards, Enrico Gratton & Marian L Waterman (2014). Wnt signaling directs
a metabolicprogram of glycolysis and angiogenesis in colon cancer. The EMBO Journal 33, 1454–1473.
Lab phone number: 051-200-6520
3. Su Yeon Lee, Hyun Min Jeon, Min Kyung Ju, Cho Hee Kim, Gyesoon Yoon, Song Iy Han, Hye Gyeong Park, and Ho Sung Kang
(2012). Wnt/Snail Signaling Regulates Cytochrome C Oxidase and Glucose Metabolism. Cancer Res 72, 14
PFKP S386 phosphorylation is required 4. Sung-Eun Kim , Won-Jeong Lee , Kang-Yell Choi (2006). The PI3 kinase-Akt pathway mediates Wnt3a-induced proliferation. Lab address: 부산광역시 사하구 낙동대로 550번길
Cellular Signalling 19, 511–518
for Wnt3A-induced the Warburg effect, 5. Mor I, Cheung EC, Vousden KH. Control of glycolysis through regulation of PFK1: old friends and recent additions. Cold Spring 37 S11-0318 암대 사학 연 구실 , Lab. Cancer
proliferation, and colony formation in Harb Symp Quant Biol. (2011) 76:211–6. doi: 10.1101/sqb.2011.76.010868 metabolism, S11-0319, Natural Science Bldg. Dong-
6. Lee JH, Liu R, Li J, Zhang C, Wang Y, Cai Q, et al. Stabilization of phosphofructokinase 1 platelet isoform by AKT promotes
cancer cells. tumorigenesis. Nat Commun. (2017) 8:949. doi: 10.1038/s41467-017-00906-9 A University, 37, Nakdong-Daero 550beon-gil saha-
7. Jong-Ho Lee, Rui Liu, Jing Li, Chuanbao Zhang, Yugang Wang, Qingsong Cai, Xu Qian, Yan Xia, Yanhua Zheng, Yuji Piao, gu, Busan, Korea
Qianming Chen, John F. de Groot, Tao Jiang & Zhimin Lu (2017). Stabilization of phosphofructokinase 1 platelet isoform by AKT
promotes tumorigenesis. Nature Communications 8, 949