
Page 69 - D. Cancer biology
P. 69
CDKN2A/p16 is a potential novel biomarker for
predicting prognosis in hepatocellular carcinoma
Abstract
Hepatocellular carcinoma (HCC) currently accounts for around 90% of all diagnosed liver cancers and ranks second as the cause of cancer fatality in South Korea.
Early diagnosis is of huge importance for HCC to be cured completely. With no doubt, it is crucial to discover a valid prognostic marker for early diagnosis of HCC. In
this study, we sought to distinguish if the expression of CDKN2A/p16, a famous cell cycle regulating protein and a marker of cellular senescence, could be a valid
prognostic marker for HCC. The observation that survival rate of HCC patients with high CDKN2A/p16 expression is significantly lower than other HCC patients
suggests could have a crucial role in the progression of HCC and be a novel prognostic marker for HCC.
Aim (Hypothesis)
To evaluate the functionality of CDKN2A/p16 as a novel prognostic factor of hepatocellular carcinoma by
using survival analysis of TCGA with receiver operating characteristic curve (ROC curve).
Results - I
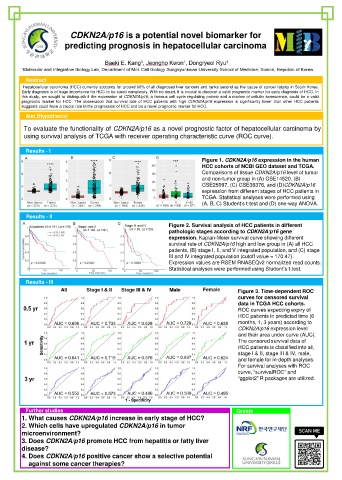
Figure 1. CDKN2A/p16 expression in the human
HCC cohorts of NCBI GEO dataset and TCGA.
Comparisons of tissue CDKN2A/p16 level of tumor
and non-tumor group in (A) GSE14520, (B)
GSE25097, (C) GSE36376, and (D)CDKN2A/p16
expression from different stages of HCC patients in
TCGA. Statistical analyses were performed using
(A, B, C) Student’s t-test and (D) one-way ANOVA.
Results - II
Figure 2. Survival analysis of HCC patients in different
pathologic stages according to CDKN2A/p16 gene
expression. Kaplan-Meier survival curve showing different
survival rate of CDKN2A/p16 high and low group in (A) all HCC
patients, (B) stage I, II, and V integrated population, and (C) stage
III and IV integrated population (cutoff value = 170.47).
Expression values are RSEM RNASEQv2 normalized read counts.
Statistical analyses were performed using Student’s t-test.
Results - III
Figure 3. Time-dependent ROC
curves for censored survival
data in TCGA HCC cohorts.
ROC curves expecting expiry of
HCC patients in predicted time (6
months, 1, 3 years) according to
CDKN2A/p16 expression level
and their area under curve (AUC).
The censored survival data of
HCC patients is classified into all,
stage I & II, stage III & IV, male,
and female for in-depth analyses.
For survival analyses with ROC
curve, “survivalROC” and
“ggplot2” R packages are utilized.
Further studies Grants
1. What causes CDKN2A/p16 increase in early stage of HCC?
2. Which cells have upregulated CDKN2A/p16 in tumor
microenvironment?
3. Does CDKN2A/p16 promote HCC from hepatitis or fatty liver
disease?
4. Does CDKN2A/p16 positive cancer show a selective potential
against some cancer therapies?