
Page 59 - D. Cancer biology
P. 59
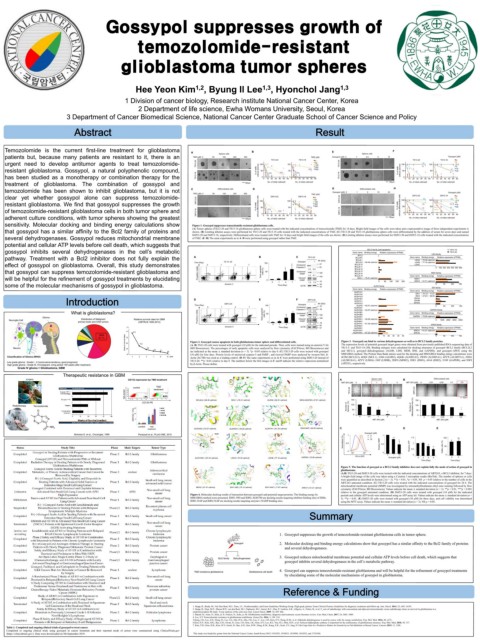
Gossypol suppresses growth of
temozolomide-resistant
glioblastoma tumor spheres
Hee Yeon Kim , Byung Il Lee , Hyonchol Jang 1,3
1,3
1,2
1 Division of cancer biology, Research institute National Cancer Center, Korea
2 Department of life science, Ewha Womans University, Seoul, Korea
3 Department of Cancer Biomedical Science, National Cancer Center Graduate School of Cancer Science and Policy
Temozolomide is the current first-line treatment for glioblastoma A B E F
patients but, because many patients are resistant to it, there is an TMZ (μM) 0 50 Sphere cells 200 500 TMZ (μM) Gossypol (μM) 0 1 Sphere cells 5 10 Gossypol (μM)
2.5
100
urgent need to develop antitumor agents to treat temozolomide- TS13-20 100 TS13-20 100 TS13-18 0 TS13-20 100 TS13-20 10 100 TS13-18 0
1
50
20
2.5
100
5
resistant glioblastoma. Gossypol, a natural polyphenolic compound, % of wells without spheres 50 200 500 50 200 500 200 % of wells without spheres 50 5 50 5 10 10
500
20
has been studied as a monotherapy or combination therapy for the TS13-18 0 0 10 20 30 40 50 60 0 0 10 20 30 40 50 60 TS13-18 0 0 10 20 30 40 50 60 0 0 10 20 30 40 50 60
treatment of glioblastoma. The combination of gossypol and 100µm No. of initial cells/well No. of initial cells/well 100µm No. of initial cells/well No. of initial cells/well
temozolomide has been shown to inhibit glioblastoma, but it is not C TMZ (μM) 0 50 Differentiated cells 200 500 D G 1 Differentiated cells 10 25 H Gossypol (μM)
5
Gossypol (μM) 0
100
clear yet whether gossypol alone can suppress temozolomide- Diff13-20 Diff13-18 TMZ (μM) Diff13-20 100 Diff13-20 50 100 Diff13-18 50 0
0
1
50
2.5
resistant glioblastoma. We find that gossypol suppresses the growth Diff13-20 % of wells without differentiated cells 100 100 500 100 % of wells without differentiated cells 50 25 50 25 5
200
10
500
20
of temozolomide-resistant glioblastoma cells in both tumor sphere and Diff13-18 50 200 500 50 200 Diff13-18 0 10 0 10
0
0
adherent culture conditions, with tumor spheres showing the greatest 100µm 0 10 20 30 40 50 60 0 10 20 30 40 50 60 100µm 0 10 20 30 40 50 60 0 10 20 30 40 50 60
No. of initial cells/well
No. of initial cells/well
No. of initial cells/well
No. of initial cells/well
sensitivity. Molecular docking and binding energy calculations show Figure 1. Gossypol suppresses temozolomide-resistant glioblastoma cells.
that gossypol has a similar affinity to the Bcl2 family of proteins and (A) Tumor spheres (TS)13-20 and TS13-18 glioblastoma sphere cells were treated with the indicated concentrations of temozolomide (TMZ) for 14 days. Bright field images of the cells were taken and a representative image of three independent experiments is
shown. (B) Limiting dilution assays were performed for TS13-20 and TS13-18 cells treated with the indicated concentrations of TMZ. (C) TS13-20 and TS13-18 glioblastoma sphere cells were differentiated by the addition of serum for seven days and named
several dehydrogenases. Gossypol reduces mitochondrial membrane Diff13-20 and Diff13-18, respectively. Differentiated cells were treated with TMZ for 14 days and bright field images of the cells are shown. (D) Limiting dilution assays were performed for Diff13-20 and Diff13-18 cells treated with the indicated concentrations
of TMZ. (E–H) The same experiments as in A–D were performed using gossypol rather than TMZ.
potential and cellular ATP levels before cell death, which suggests that
gossypol inhibits several dehydrogenases in the cell’s metabolic Gene name Binding energy Relative expression (FPKM) LDH family TS13-18
BCL2 family (anti-apoptotic)
TS13-20
BCL2
pathway. Treatment with a Bcl2 inhibitor does not fully explain the A B C TS13-20 Mr (kDa) BCL2A1 BCL2A1 Gene name Binding energy Relative expression (FPKM)
BCL2
BCL2L1
LDHA − 70.39 cals/mol
BCL2L1
LDHA
Gossypol
BCL2L2 − 68.46 cals/mol
LDHB − 77.16 cals/mol
effect of gossypol on glioblastoma. Overall, this study demonstrates Time (Day) 0 Q1_UR Q1_UL 1 TS 13- 20 4 Q1_UR Q1_UL 7 Q1_UR 100 * * Caspase-3 - + 37 BCL2L10 BCL2L10 LDHC LDHB 00 100 200 300 400 500 600
BCL2L2
Uncleaved
LDHC
BCL2L11
25
BCL2L11
400 500 600
Q1_UR
Q1_UL
Q1_UL
200
100
300
cells (%)
that gossypol can suppress temozolomide-resistant glioblastoma and Propidium iodide Early apoptotic Number of cells (%) 100 Uncleaved 1.0 0.0 100 BCL2L12 BCL2L12 MDH family
BCL2L13
50 50
BCL2L13
BCL2L14
PARP
BCL2L14
will be helpful for the refinement of gossypol treatments by elucidating Q1_LL Q1_LR Q1_LL Q1_LR Q1_LL Q1_LR Q1_LL Q1_LR Cleaved 1.0 0.1 100 BCL2L15 BCL2L15 Gene name Binding energy Relative expression (FPKM)
MCL1 − 76.41 cals/mol
MDH1
MCL1
MDH1
10 2
10 1
100
150
200
MDH2
10 3 10 4 10 5 10 1 10 2 10 3 10 4 10 5 10 1 10 2 10 3 10 4 10 5 1 2 3 4 5 0 0 0 0 1 1 4 4 7 7 PARP 1.0 1.8 75 0 0 50 50 100 150 200 MDH2 − 57.41 cals/mol
some of the molecular mechanisms of gossypol in glioblastoma. Annexin V Time (Day) ACTB 37 ALDH family 00 50 50 100 150
50
150
100
Gene name Binding energy Relative expression (FPKM) IDH family
ALDH1A1 ALDH1A1 Gene name Binding energy Relative expression (FPKM)
IDH1
ALDH1A2 ALDH1A2 IDH1 − 78.12/ − 71.67
ALDH1A3 ALDH1A3 IDH2 − 47.61/ − 69.85
IDH2
D E F Diff13-20 ALDH1B1 ALDH1B1 IDH3A IDH3A
IDH3B
Early apoptosis (LR) ALDH1L1 ALDH1L1 IDH3B
Diff13-20 Gossypol - + Mr (kDa) ALDH1L2 ALDH1L2 IDH3G IDH3G
Time (Day) 100 37 ALDH2 − 62.61 cals/mol 00 50 50 100 150
ALDH2
0 1 4 7 Uncleaved ALDH3A1 ALDH3A1 100 150
Q1_UL Q1_UR Q1_UL Q1_UR Q1_UL Q1_UR 5 Q1_UL Q1_UR Caspase-3 25 ALDH3A2 − 52.07 cals/mol GAPDH family
5
5
ALDH3A2
What is glioblastoma? 4 4 4 Early apoptotic Number of cells (%) 100 ** Uncleaved 1.0 0.5 ALDH3B1 ALDH3B1 Gene name Binding energy Relative expression (FPKM)
cells (%)
50 50
ALDH3B2
Glioma Propidium iodide 3 2 3 2 3 2 PARP 1.0 0.4 100 ALDH4A1 ALDH3B2 GAPDH − 75.66 cals/mol
GAPDH
ALDH4A1
100
Neuroglia Cell Distribution of Malignant Relative survival rates for GBM Q1_LL Q1_LR Q1_LL Q1_LR Q1_LL Q1_LR 1 Q1_LL Q1_LR Cleaved ALDH5A1 − 49.26 cals/mol 00 1000 2000 3000 4000
ALDH5A1
1000
3000
4000
2000
1
primary brain and CNS tumors (CBTRUS 1995-2012) 0 0 PARP ALDH6A1 ALDH6A1
10 2
10 1
10 3 10 4 10 5 10 1 10 2 10 3 10 4 10 5 10 1 10 2 10 3 10 4 10 5 10 1 10 2 10 3 10 4 10 5 1.0 2.9 75 ALDH7A1 − 61.34 cals/mol
ALDH7A1
0 0 1 4 4 7 50 APEX family
7
1
Annexin V Time (Day) ACTB 37 ALDH8A1 ALDH8A1 Gene name Binding energy Relative expression (FPKM)
ALDH9A1
Time (Day)
ALDH9A1
ALDH16A1 ALDH16A1 APEX1 − 61.21 cals/mol
APEX1
ALDH18A1 − 67.22 cals/mol APEX2 APEX2
ALDH18A1
GBM 00 10 10 20 20 30 30 40 40 50 50 0 50 100 150
46.1% 0 50 100 150
Figure 2. Gossypol causes apoptosis in both glioblastoma tumor sphere and differentiated cells. Figure 3. Gossypol can bind to various dehydrogenases as well as to BCL2 family proteins.
(A, B) TS13-20 cells were treated with gossypol (10 μM) for the indicated periods. Then, cells were stained using an annexin V kit The expression levels of potential gossypol target genes were obtained from previously published RNA-sequencing data of
Neuron (BD Biosciences). The percentages of early apoptotic cells were analyzed by flow cytometry (FACSVerse; BD Biosciences) and TS13-2- and TS13-18 [30]. Binding energies were calculated for docking structures of gossypol–BCL2 family (BCL2L2
are indicated as the mean ± standard deviation (n = 3). *p <0.05 relative to day 0. (C) TS13-20 cells were treated with gossypol and MCL1), gossypol–dehydrogenases (ALDH, LDH, MDH, IDH, and GAPDH), and gossypol–APEX using the
(10 μM) for four days. Protein levels of uncleaved caspase-3 and PARP , and cleaved PARP were analyzed by western blot. β- MM/GBSA method. The Protein Data Bank entries used for the docking and MM/GBSA binding energy calculations were
Classification of Glioma (WHO) Actin (ACTB) was used as a loading control. (D–F) The same experiments as in A–C were performed using Diff13-20 instead of 4CIM (BCL2L2), 4OQ5 (MCL1), 1O04 (ALDH2), 4QGK (ALDH3A2), 2W8N (ALDH5A1), 4ZVX (ALDH7A1), 2H5G
TS13-20. **p <0.01 relative to day 0. The numbers below the blot images in C and F indicate the relative expression normalized (ALDH18A1), 4ZVV (LDHA) 1I0Z (LDHB), 2DFD (MDH2), 5DE1 (IDH1), 4JA8 (IDH2), 1U8F (GAPDH), and 5DFI
Low grade glioma : Grade I , II (noninvasive tendency, good prognosis) (APEX1), respectively.
High grade glioma : Grade III, IV(malignant, living period <50 weeks after treatment) by β-Actin Please define.
Grade IV glioma = Glioblastoma, GBM
Therapeutic resistance in GBM
surgery CD133 expression by TMZ treatment A Sphere cells B Differentiated cells
ABT-263 (μM) 0 0.5 1 2 3 ABT-263 (μM) 0 0.01 0.05 0.1 0.5
TMZ
control treatment Diff13-20
SK-N-SH TS13-20
BCL2L2 (-68.46 cal/mol) MCL1 (-76.41 cal/mol) ALDH2 (-62.61 cal/mol) IDH2-AGI6780 (-47.61 cal/mol) 150 20µm 150 20µm
CD133-PE
Radiotherapy Temozolomide Number of Spheres (%) 100 ns 100
40 50 * Number of differentiated cells (%) 50
CD133 + (%) 20 0 0 0.5 ABT-263 (μM) ** 3 0 0 0.01 ABT-263 (μM) 0.1 0.5
2
1
0.05
0
control TMZ
treatment ALDH3A2 (-52.07 cal/mol) ALDH5A1 (-49.26 cal/mol) ALDH7A1 (-61.34 cal/mol) IDH2-NAP (-69.85 cal/mol) C D E
Gossypol (μM)
Nicholas G. et al., Oncologist, 1999 Perazzoli et al., PLoS ONE, 2015 1 0 100 1 150 100
Normalized (%) 0.5 Relative MMP 50 0.5 Relative ATP 100 1 ** 50 50
1.5
1
100
10 *** ** ns
50
0 10 2 10 3 0.5 ** Viable cells (%)
10 2 10 3 0
0 0 1 10 0 0
PE-A (ΔΨ) 0 1 10 0 0 0 3
ALDH18A1 (-67.22 cal/mol) LDHA (-70.39 cal/mol) LDHB (-77.16 cal/mol) GAPDH (-75.66 cal/mol) Gossypol (μM) 0 0 2 2 3 4 0 3
3
4
Time (Day) Time (Day)
Figure 5. The function of gossypol as a BCL2 family inhibitor does not explain fully the mode of action of gossypol in
glioblastoma.
(A,B) TS13-20 and Diff13-20 cells were treated with the indicated concentrations of ABT263, a BCL2 inhibitor, for 7 days.
A bright field image of the cells was taken using a Cytation 3 microplate reader (BioTek). The number of spheres or cells
were quantified as described in Section 2 (n = 3). **p < 0.01, *p < 0.05, NS p > 0.05 relative to the number of cells in the
ABT-263 untreated condition. (C) TS13-20 cells were treated with the indicated concentrations of gossypol for 24 h. The
mitochondrial membrane potential (MMP) was investigated by tetramethylrhodamine ethyl ester staining followed by flow
MDH2 (-57.41 cal/mol) IDH1-59D (-78.12 cal/mol) IDH1-NAP (-71.67 cal/mol) APEX1 (-61.21 cal/mol)
cytometry (FACSVerse; BD Biosciences). Values indicate the mean ± standard deviation (n = 3). **p < 0.01, ***p < 0.001
relative to the gossypol untreated condition. (D) Diff13-20 cells were treated with gossypol (10 μM) for the indicated
Figure 4. Molecular docking results of interaction between gossypol and potential target proteins. The binding energy by periods and cellular ATP levels were determined using an ATP assay kit. Values indicate the mean ± standard deviation (n =
MM/GBSA method were presented. IDH1-59D and IDH2-AGI6780 are docking results targeting inhibitor binding sites of IDHs. 3). **p < 0.01. (E) Diff13-20 cells were treated with gossypol (10 μM) for three days, and cell viability was determined
IDH1-NAP and IDH2-NAP are docking results targeting enzyme’s NADP binding sites. using the MTT assay. Values indicate the mean ± standard deviation (n = 3). NS p > 0.05.
1. Gossypol suppresses the growth of temozolomide-resistant glioblastoma cells in tumor sphere.
Gossypol 2. Molecular docking and binding energy calculations show that gossypol has a similar affinity to the Bcl2 family of proteins
and several dehydrogenases.
3. Gossypol reduces mitochondrial membrane potential and cellular ATP levels before cell death, which suggests that
Bcl2 family Dehydrogenases
gossypol inhibits several dehydrogenases in the cell’s metabolic pathway.
4. Gossypol can suppress temozolomide-resistant glioblastoma and will be helpful for the refinement of gossypol treatments
TMZ-resistance glioblastoma Glioblastoma cell death
by elucidating some of the molecular mechanisms of gossypol in glioblastoma.
1. Stupp, R.; Brada, M.; Van Den Bent, M.J.; Tonn, J.C.; Pentheroudakis, and Esmo Guidelines Working Group. High-grade glioma: Esmo Clinical Practice Guidelines for diagnosis, treatment and follow-up. Ann. Oncol. 2014, 25, iii93–iii101.
2. Stupp, R.; Hegi, M.E.; Mason,W.P.; van den Bent, M.J.; Taphoorn, M.J.; Janzer, R.C.; Hau, P.; Ludwin, S.K.; Allgeier, A.; Fisher, B.; et al. E_ects of radiotherapy with concomitant and adjuvant temozolomide versus radiotherapy alone on survival in glioblastoma in a
randomized phase III study: 5-year analysis of the eortc-ncic trial. Lancet Oncol. 2009, 10, 459–466.
3. Batash, R.; Asna, N.; Scha_er, P.; Francis, N.; Scha_er, M. Glioblastoma multiforme, diagnosis and treatment; recent literature review. Curr. Med. Chem. 2017, 24, 3002–3009.
4. Lee, S.Y. Temozolomide resistance in glioblastoma multiforme. Genes Dis. 2016, 3, 198–210.
5.Kang, J.H.; Lee, S.H.; Hong, D.; Lee, J.S.; Ahn, H.S.; Ahn, J.H.; Lee, C.; Lee, J.H.; Kim, S.Y.; Hong, K.M.; et al. Aldehyde dehydrogenase is used by cancer cells for energy metabolism. Exp. Mol. Med. 2016, 48, e272.
6.Kim, H.Y.; Kim, D.K.; Bae, S.H.; Gwak, H.; Jeon, J.H.; Kim, J.K.; Kim, S.Y.; Lee, B.I.; You, H.J.; Shin, D.H.; et al. Farnesyl diphosphate synthase is important for the maintenance of glioblastoma stemness. Exp. Mol. Med. 2018, 50, 137.
7. Kim, Y.H.; Kim, H.K.; Kim, H.Y.; Gawk, H.; Bae, S.H.; Sim, H.W.; Hong, K.M.; Kang, E.K.; Seoh, J.Y.; Jang, H. Fak-Copy-Gain Is a Predictive Marker for Sensitivity to Fak Inhibition in Breast Cancer. Cancers 2019, 11, 1288.
Table 1. Completed and ongoing clinical trials of gossypol to treat cancer.
Completed or ongoing clinical trials using gossypol in cancer treatment and their reported mode of action were summarized using ClinicalTrials.gov
(https://clinicaltrials.gov/). Data were downloaded on 5th September 2019. This study was funded by grants from the National Cancer Center, South Korea (NCC-1910292, 1910033, 1810990, 1810292, and 1710190)