
Page 53 - D. Cancer biology
P. 53
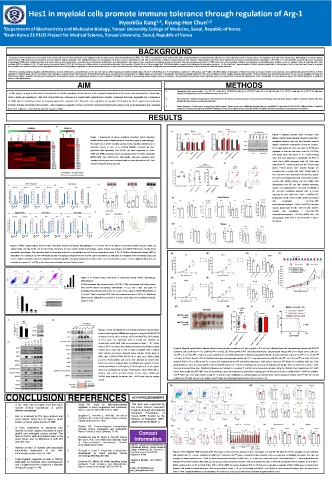
Hes1 in myeloid cells promote immune tolerance through regulation of Arg-1
                                        HyeokGu Kang , Kyung-Hee Chun 1,2
                                                    1,2
  1 Department of Biochemistry and Molecular Biology, Yonsei University College of Medicine, Seoul, Republic of Korea
  2 Brain Korea 21 PLUS Project for Medical Science, Yonsei University, Seoul, Republic of Korea
                                              BACKGROUND
    Resistance to tumor treatment can be intrinsic to the tumor cells, but it is often conferred by non-malignant cells that make up the tumor microenvironment (TME). The TME is composed of tissue-resident cells and a large proportion of recruited immune cells that, in certain solid tumor such as breast cancer, can constitute up to 50% of the tumor mass. Macrophages are tissue-resident
    innate immune cells important in homeostasis and host defense against pathogens. The biological functions of macrophage are diverse and not only limited to their role as the first line of defense during innate immune response. Macrophages have both tumor-suppressing and tumor-promoting function depending on the TME. It is now generally accepted that tumor associated
    macrophages (TAM) have an M2 phenotype and show mostly pro-tumoral functions, promoting tumor cell survival, proliferation, and dissemination. Also support tumor progression by blocking anti-tumor immunity. The immuno-suppressive effect of TAM stems from their enzymatic activities and production of anti-inflammatory mediator, such as arginase-1 (Arg-1), inducible nitric oxide
    synthase (iNOS), interleukin-10 (IL-10) and transforming growth factor β (TGF-β), that have an inhibitory effect on tumoricidal lymphocytes. More recently, Franklin RA et al. demonstrated that TAM differentiation requires Notch-dependent transcriptional program. On the other hand, hyper-activation of Notch signaling specifically in macrophage in tumor mass has been shown to suppress
    tumor growth in an animal model of cancer. Investigations into how Notch signaling is regulated in TAM and translates into pro- or anti-tumor functions are still not fully understood. Additionally, the downstream molecular mediators of Notch function in TAM are largely unknown.
    The Notch signaling pathway regulates cell differentiation, survival, development, and proliferation. In the immune system, Notch signaling is involved multiple steps of B and T cell development, T cell activation, regulatory T cell function, and T helper cell differentiation. Investigation of Notch responses has focused mainly on lymphocytes, and understanding about the effects of Notch
    signaling in myeloid lineage cells is more limited. Hes1 belongs to a family of basic helix-loop-helix DNA-binding proteins and is essential for the development of multiple organs and cell types. Consequently, mice that are globally deficient in Hes1 are not viable and show multiple developmental defects. Previous Studies have shown that expression of Hes1 can be regulated by innate and
    inflammatory signals. However, the molecular mechanisms, transcriptional targets and physiological relevance of Hes1-mediated modulation of function in macrophage remain largely unknown. According to the preceding circumstances, Notch signaling seems to be important in immune cell development and in functionality. And also there are reports that Notch signaling is a significant
    factor in TAM differentiation.
                          AIM                                             METHODS
                                                       1.  Heterotopic graft tumor models : 1.0 x 10 5 TC-1 cells, 2.5 x 10 5 B16F10 cells, 5.0 x 10 5 E0771 cells, 5.0 x 10 5 MC-38 cells, 1.0 x 10 6 4T-1 cells and 1.0 x 10 6 CT-26 cells were
    In this study, I sought to determine the importance of Notch signaling relative factors in the myeloid compartment of the tumor microenvironment. Especially,  injected subcutaneously into the middlelower back of the mice.
    Hes1 is highly up-regulated in TAM. And I found that Hes1 deficiency in myeloid cells restricts tumor growth. I observed that Hes1 regulated Arg-1 expression  2.  Flow cytometry : Single-cell suspensions were made from the spleens and bone marrow of normal and tumor-bearing mice and tumor tissues. Spleens and bone marrow cells were
    of TAM, which is defining feature of immunosuppressive myeloid cells. Therefore, the regulation of myeloid cell function by Hes1 suppressed anti-tumor  labeledwith fluorescence-conjugatedantibodies.
    function, thereby promoting tumor growth. Taken together, regulation of Hes1 by tumor microenvironment factor plays a role in tumorigenesis and I propose  3.  Tumor digestion : Tumors were extracted and finely minced. Tumor tissue was additionally blended with the gentleMACS Dissociator (#130-093-235, Miltenyi Biotec, Berghisch
    that Hes1 might be a potential therapeutic target in TAM.  Glatbach, Germany) and digested with MACS Miltenyi Tumour Dissociation Kit for mouse (#130-096-730, Miltenyi Biotec) according to manufacturer’s instructions.
                                                 RESULTS
                                                                                          Figure 5: Myeloid specific Hes1 knockout mice
                               Figure 1. Expression of genes encoding canonical notch signaling  display normal hematopoiesis. Myeloid-specific Hes1
                               related factors show different patterns in various types of macrophages.
                                                                                          conditional knockout mice and their littermate controls
                               (A) Expression of genes encoding canonical notch signaling related factor in  display Comparable development of immune systems.
                               untreated (CTRL) or LPS- or IL-4-treated BMDMs, assessed by next-  Six to eight weeks old mice were used. (A-B) Different
                               generation RNA-sequencing (GSE99296). (B) Gene expression of sorted
                                                                                          population of immune cells were sorted by FACSAria
                               TAMs and MTMs (mammary tissue macrophages) from 16 weeks old female  from tumor tissue and spleen of TC-1 tumor bearing
                               MMTV-PyMT mice (GES56755). Differentially expressed canonical notch
                                                                                          mice, And then performed a quantitative RT-PCR to
                               signaling related genes were determined with a p-value threshold of 0.05. Fold  check Hes1 mRNA expression level. (C) Cells were
                               change is depicted using a log scale.                      sorted from TC-1 tumor bearing mice by FACSAria and
                                                                                          plated. Protein lysates were isolated through cell
                                                                                          homogenization in protein lysis buffer. Protein levels of
                                                                                          Hes1 and Hey1 were detected by western blot. β-actin
                                                                                          was used as a loading control. (D) Total number of Bone
                                                                                          marrow cells, BMDM number and Cell viability after
                                                                                          differentiation from WT and Hes1 deficient littermates
                                                                                          controls. (E) Representative FACS plots of BMDMs in
                                                                                          WT and Hes1 conditional knockout mice. (F-I) Flow
                                                                                          cytometry for stem cells (c-kit + ; Sca-1 + ; c-kit int Sca-1i nt ),
                                                         (F)            Bone Marrow       lymphocytes (T cells: CD3 + ; B cells : B220 + ) and myeloid
                                                                                          cells  (neutrophils  :  CD11b + Gr-1 high ;
                                                                                          monocytes/macrophages : CD11b + Ly-6G dull ) in the bone
                                                                                          marrow; lymphocytes (T cells : CD3 + ; B cells : B220 + ),
                                                                                          myeloid  cells  (neutrophils  :  CD11b + Gr-1 high ;
                                                                                          monocytes/macrophages : CD11b + Ly-6G dull ) and T cell
                                                                                          Subpopulation (CD3 + CD4 + T cell; CD3 + CD8 + T cell) in
                                                                                          the spleen.
                                                         (G)             Spleen
    Figure 2. TAMs express higher levels of Hes1 than bone marrow and spleen macrophages. RT and Real-Time PCR analysis of (A) Notch receptor, (B) DLL family, (C)
    Jagged family, (D) Hey family and (E) Hes family abundance in bone marrow derived macrophages, spleen derived macrophages and MMTV-PyMT tumor bearing tumor
    associated macrophages. The expression level of β-actin was analyzed for normalization control. Data are presented as mean ± SD. (F-G) Mean fluorescence intensity (MFI) of  (A)  (B)  (E)  (F)
    intracellular Hes1 staining in CD11b + F/80 + double positive macrophages isolated from bone marrow, spleen and tumors (as indicated). (H) Histogram of the intracellular expression
    of Hes1. Spleen and tumor cells were subjected to enzymatic digestion each group included at least three mice. Data are presented as mean ± SEM. Significant differences are
    indicated by an asterisk (* p<0.05), and p values were calculated using the Student’s t test.
                           Figure 3. In normal states, Hes1 level is decreased during murine macrophage  (C)  (D)
                           differentiation.
                           (A) Representative flow cytometry plots of CD11b + F4/80 + macrophage cells during murine
                           bone marrow derived macrophage differentiation at 1,3,5 and 7 days. (B) Graph of
                           quantifying flow cytometry plot results. (C) Levels of Hes1 gene in BMDM differentiation at
                           1,3,5 and 7 days by real-time PCR. Data are presented as mean ± SD (n=3). Significant
                           differences are indicated by an asterisk (* p<0.05), and p values were calculated using the
                           Student’s t test.
                                                          (G)              (H)     (I)   (J)  Median survival : 194
                                                                   200 Days    p = 0.0419
                                                                               5-6
                                                                               mont  p = 0.6573
                                                           MMTV-LysM-          h              Median survival : 215
                                                            Hes1 +/+
                                                           MMTV-LysM-
                                                            Hes1 fl/+                               p = 0.0007
                                 Figure 4. Tumor soluble factor and Th2 type cytokine increases Hes1
                                 level, but not hypoxia. BMDMs were exposed to normoxia (20.9% O2; N)
                                 or hypoxia (1% O2; H) for 24 hours. (A) RT and Real-Time PCR analysis
                                 of Hes1 gene. The expression level of β-actin was analyzed for
                                 normalization control (left). Data are expressed as Mean ± SD. Protein
                                 levels of HIF-1α and Hes1 were detected by western blot (Right). Loading
                                 controls were β-actin. (B) In vitro co-culture of BMDMs with or without  Figure 6. Myeloid specific Hes1 deletion display tumor growth retardation. (A) Tumor growth in WT and Hes1 deficient littermates subcutaneously injected with B16F10
                                                          melanoma cells (LysM-Hes1 +/+ n=3, LysM-Hes1 fl/fl n=3 mice). (B) Tumor growth in WT and deficient littermates subcutaneously injected with E0771 breast cancer cells (Cre -
                                 tumor cell line and human embryonic kidney cell line. Protein levels of
                                 NICD, Hes1, p-STAT3 (Y705), STAT3, PD-L1, Hey1, Arg-1, iNOS, CD206,  ,Hes1 fl/fl n=5, Cre + ,Hes1 fl/fl n=5 mice). (C) Tumor growth in WT and deficient littermates subcutaneously injected with MC-38 colon carcinoma cells (Cre - ,Hes1 fl/fl n=5, Cre + ,Hes1 fl/fl
                                                          n=5 mice). (D) Tumor growth in WT and deficient littermates subcutaneously injected with TC-1 Lung adenocarcinoma cells (Cre - ,Hes1 fl/fl n=5, Cre + ,Hes1 fl/fl n=5 mice). (E) Tumor
                                 p-Erk1/2 (Thr202/Tyr204) and Erk1/2 were detected by western blot.  weight of B16F10, E0771, MC-38 and TC-1 cancer cells implanted into the WT and deficient littermates. Color scheme represents WT (black), Hes1-deficient (red) mice. Each
                                 Erk1/2 was used as loading control. (C) BMDMs were exposed or not to
                                 murine recombinant IL-4 (20 ng/mL), IL-10 (10 ng/mL), IL-13 (10 ng/mL)  group included 3-5 mice. (F) Tumor growth in mice treated with anti M-CSF-1R (CSF1R antibody), anti Ly-6G (Ly-6G antibody) and anti IgG. Data are expressed as mean ± SEM.
                                                          Each group included three mice. Significant differences are indicated by an asterisk (* p<0.05), and p values were calculated using the Student’s t test. Myeloid-Hes1 KO PyMT
                                 alone or in combination for 36 hours. Protein levels of Hes1, NICD, IRF-4,
                                 PPAR-γ, and STAT3, p-STAT6 (Y641), STAT6, Arg-1, CD206 and  tumors were smaller than WT PyMT mice. (G) At 200days, tumors were isolated and presented in a photograph. (H) Total tumor burden of LysMcre-Hes1 +/+ PyMT and LysMcre-
                                                          Hes1 fl/+ PyMT mice at 20 and 24 weeks of age (n=17) and (I) Tumor multiplicity in a statistical graph. (J) Survival of mice tumor bearing of LysMcre-Hes1 +/+ PyMT (N=10) and
                                 GAPDH were detected by western blot. GAPDH was used as loading  LysMcre-Hes1 fl/+ PyMT mice (N=14). LysMcre- Hes1 fl/+ PyMT mice display prolongedsurvival. Data are mean ± SD.
                                 control.
                                                        (A)                       (B)
   CONCLUSION REFERENCES                    ACKNOWLEDGEMENTS
   •  In the TAM, Hes1 is higher level than bone  1.  [Quail  DF,  Joyce  JA.  Microenvironmental  This work was supported by
      marrow  derived  macrophage  or  spleen  regulation of tumor progression and metastasis.  the Basic Science Research
      derived macrophage.  Nature medicine 2013;19(11):1423-1437]  Program through the National
                                            Research  Foundation  of
   •  Hes1 is increased by Th2 type cytokines and  2.  [Engblom C, Pfirschke C, Pittet MJ. The role of  Korea (NRF) funded by the
      tumor soluble factor, but not hypoxia, which  myeloid cells in cancer therapies. Nature reviews.  Ministry of Education (NRF-
      known as typical characteristics of TME.  Cancer 2016;16(7):447-462]  2020R1IA1A0107289311).
   •  In mice,  engineered to selectively lack  3.  [Pollard  JW.  Tumour-educated  macrophages  (C)  (D)
      myeloid cell Hes1, display retardation of tumor  promote tumour progression and metastasis.
                           Nature Reviews Cancer 2004;4(1):71-78]
      growth and prolonged mouse survival. The  Contact
      ratio of CD45+ cells and myeloid cells in the  4.  [Franklin RA, Liao W, Sarkar A, Kim MV, Bivona
      tumor tissue was no difference in both WT  MR, Liu K, et al. The cellular and molecular origin  information
      and cKO mice.        of  tumor-associated  macrophages.  Science
                           2014;344(6186):921-925]  Address : Department of Biochemistry
   •  Ablation of Hes1 in myeloid cells decreased  & Molecular Biology, Yonsei University
      intracellular  expression  of  the  anti-  5.  [Tanigaki K, Honjo T. Regulation of lymphocyte  College of Medicine, 50-1 Yonsei-ro,
      inflammatory marker Arg-1 in TAM.  development  by  Notch  signaling.  Nature  Seodaemun-gu, Seoul 03722,   Figure 7. Hes1 regulates TAM functions. (A-B) Percentage of total, monocyte, granulocyte, DC, macrophage, T, B and NK cells within the CD45+ population of tumor infiltrating
                                           Repubic of Korea
                           immunology 2007;8(5):451-456]  cells isolated from TC-1 tumors engrafted in LysM-Hes1 +/+ and Lysm-Hes1 fl/fl mouse, estimated by flow cytometry. Data are expressed as individual data points (n>5 mice per
   •  Taken together, regulation of Hes1 in TAM by  Telephone (Mobile) : +82-10-5331-  genotype as shown) and mean bar ± SEM. (C) Mean Fluorescence Intensity of CD206, IFN-γ, IL-12 and Arg-1 expression on the TAM isolated from TC-1 tumor engrafted into the
      TME plays an important role in tumorigenesis  6.  [Osborne BA, Minter LM. Notch signalling during  9448  indicated WT and Hes1 deficient littermates (n=5 per group), measured by flow cytometry. Data are expressed as mean ± SEM. (D) Quantitative PCR of metabolic enzyme (Arg-1,
      and I suggest that Hes1 might be a potential  peripheral T-cell activation and differentiation.  iNOS), cytokines (IL-6, IL-10, IL-12p40, IFN-γ, TNF-α, VEGF, MMP-9), immune checkpoint (PD-L1, PD-L2) and co-stimulatory molecules (CD80, CD86) genes in isolated Hes1
      therapeutic target in TAM.  Nature reviews Immunology 2007;7(1):64-75]  Email : Hk1038@yuhs.ac,   deficient TAM relative to control littermates. Data are presented as mean ± SD. (E-F) Percentage of M-MDSC and G-MDSC in bone marrow and spleen. Data are expressed as
                                           time_liberty@hanmail.net  mean ± SEM. Significant differences are indicatedby an asterisk (* p<0.05), and p values were calculated using the Student’s t test.