


Page 251 - ebook
P. 251
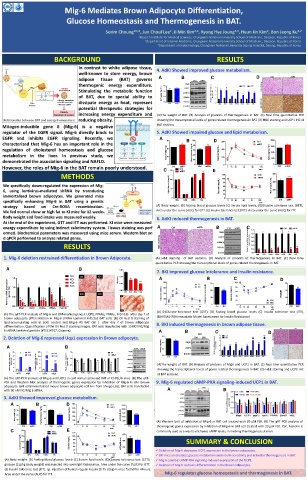
Mig-6 Mediates Brown Adipocyte Differentiation,
Glucose Homeostasis and Thermogenesis in BAT.
2
2
2,3
2,3
1,2
Sorim Choung* , Jun Choul Lee ,Ji Min Kim , Kyong Hye Joung , Hyun Jin Kim , Bon Jeong Ku 1,2
1 Reserch Institute for Medical Sciences, Chungnam National University School of Medicine, Daejeon, Republic of Korea
2 Department of Internal Medicine, Chungnam National University School of Medicine, Daejeon, Republic of Korea
3 Department of Endocrinology, Chungnam National University Sejong Hospital, Sejong, Republic of Korea
BACKGROUND RESULTS
In contrast to white adipose tissue,
4. AdKI Showed improved glucose metabolism.
well-known to store energy, brown
adipose tissue (BAT) governs A B C D
thermogenic energy expenditure. 0.3 4 * Ctrl adKI
Stimulating the metabolic function 0.2 R e lativ e m R N A e xp re ssio n 3 * *** *** *
of BAT, due to special ability to BAT mass(g/100g BW) 0.1 (g e n e s/18s) 2 1 *
dissipate energy as heat, represent 0.0 Ctrl adKI 0 Mig6 UCP1 Pgc1α PPARα Elovl3 Cidea HSL
potential therapeutic strategies for
increasing energy expenditure and (A)The weight of BAT. (B) Analysis of proteins of thermogenesis in BAT. (C) Real time quantitative PCR
Relationship between BAT and energy homeostasis reducing obesity. showing the transcriptional levels of genes related thermogenesis in BAT. (D) H&E staining and UCP1 IHC of
Mitogen-inducible gene 6 (Mig-6) is a negative BAT sections.
regulator of the EGFR signal. Mig-6 directly binds to 5. AdKI Showed impaired glucose and lipid metabolism.
EGFR and inhibits EGFR signaling. Recently, we A
30 B 100 D 300 Ctrl 2000
characterized that Mig-6 has an important role in the * 80 * * adKO 1500
regulation of cholesterol homeostasis and glucose body weight (g) 20 Blood glucose (mg/dl) 60 200 AUC (mg/dL.min) 1000
metabolism in the liver. In previous study, we 10 40 Glucose (mg/dL) 100 * 500
demonstrated the association signaling and NAFLD. 20
0 0 0 0 Ctrl adKO
However, the roles of Mig-6 in the BAT remain poorly understood. C 150 Ctrl adKO Ctrl * adKO E min
30
15
0
120
90
60
Ctrl
adKO
METHODS 100 120 Ctrl 600
adKO
100
We specifically down-regulated the expression of Mig- Lipid Level (mg/dl) Glucose (mg/dL) 80 AUC (mg/dL.min) 400
60
6, using lentivirus-mediated shRNA by transducing 50 40 200
immortalized brown adipocytes. We generated mice 0 20 0 0
120
30
0
90
60
15
specifically enhancing Mig-6 in BAT using a genetic HDL LDL CHO TG min Ctrl adKO
strategy based on Cre-ROSA recombination. (A) Body weight. (B) Fasting blood glucose levels (C) Serum lipid levels. (D)Glucose tolerance test (GTT).
We fed normal chow or high fat to KI mice for 12 weeks. Area under the curve (AUC) for GTT. (E) Insulin tolerance test (ITT). Area under the curve (AUC) for ITT.
Body weight and food intake was measured weekly. 6. AdKI reduced thermogenesis in BAT.
At the end of the experiment, GTT and ITT was performed. KI mice were measured
energy expenditure by using indirect calorimetry system. Tissues staining was perf A B C 1.2 Ctrl adKO
ormed. Biochemical parameters was measured using mice serum. Western blot an 1.0
d qPCR performed to analyze related genes. R e la tiv e m R N A e x p r e s s io n (g e n e s /1 8 s ) 0.8
0.6
RESULTS 0.4 *** *** ** * ** ***
0.2
0.0 **
Mig6 UCP1 Pgc1α PPARα Elovl3 Cidea HSL
1. Mig-6 deletion restrained differentiation in Brown Adipocyte. (A) H&E staining of BAT sections. (B) Analysis of proteins of thermogenesis in BAT. (C) Real time
quantitative PCR showing the transcriptional levels of genes related thermogenesis in BAT.
A B 0.06
7. BKI improved glucose intolerance and insulin resistance.
Ctrl 0.04
1.5 KO1 OD value 0.02 *** *** *** A B C D 30
Relative mRNA expression (genes/18s) 1.0 * *** * ** ** *** * * * KO3 0.00 Ctrl KO1 KO2 KO3 HOMA-IR 20 **
KO2
0.5
10
0.0 * * *** *** * * * 0 Ctrl BKI
Mig6 UCP1 PPAR PPAR Prdm16
(A) D)Glucose tolerance test (GTT). (B) Fasting blood glucose levels (C) Insulin tolerance test (ITT).
(A) The qRT-PCR analysis of Mig-6 and BAT-marked genes ( UCP1, PPARα, PPARγ, Prdm16) after day 7 of
brown adipocyte differentiation in Mig-6 shRNA Lentiviral infected BAT cells. (B) Oil Red O staining of (D)HOMA-IR(Homeostatic Model Assessment for Insulin Resistance)
lipid-accumulating cells in both control and Mig-6 KO BAT cell ) after day 7 of brown adipocyte 8. BKI induced thermogenesis in brown adipose tissue.
differentiation. Quantification of the Oil Red O staining images. BAT cells transfected with 15MOI NC/Mig
6 shRNA Lentiviral particle (#TL510917, Origene). A B C D
2. Deletion of Mig-6 repressed Ucp1 expression in Brown adipocyte. 0.3 *
A B Mass(g/100g BW) 0.2
0.1
10 8 ** Ctrl 400 *** Ctrl 1.5 NC 0.0 Ctrl BKI
Relative mRNA expression (genes/18s) 6 4 * Relative mRNA expression (genes/18s) 6 4 *** Relative mRNA expression (genes/18s) 1.0 *** * ** *** * *** (A)The weight of BAT. (B) Analysis of proteins of Mig6 and UCP1 in BAT. (C) Real time quantitative PCR
siMig-6
Cold
Cold
300
0.5
0 2 2 0 0.0 * showing the transcriptional levels of genes related thermogenesis in BAT. (D) H&E staining and UCP1 IHC
UCP1 mig6 UCP1 mig6 Mig6 UCP1 Pgcl1 CPT1 Elovl3 PPAR HSL of BAT sections.
(A) The qRT-PCR analysis of Mig-6 and UCP1 in cold stimuli activated BAT of C57BL/6 mice. (B) The qRT-
PCR and Western blot analysis of thermogenic genes expression by inhibition of Mig-6 in BAT brown 9. Mig-6 regulated cAMP-PKA signaling-induced UCP1 in BAT.
adipocyte. BAT cell(Immortalized mouse brown adipocyte cell line from Shingo Lab); BAT cells transfected
with 50 nM NC/Mig 6 siRNA. A B
3. AdKI Showed improved glucose metabolism.
A 40 B 150 D 500 Ctrl 2500
adKI
400
2000
body weight (g) 30 * Fasting Glucose (mg/dL) 100 * Glucose (mg/dL) 300 * * * AUC (mg/dL.min) 1500 ***
20
200
1000
50
10
0 0 100 0 ** 500 0 (A) Western bolt of inhibition of Mig-6 in BAT cell treated with 20 μM FSK. (B) The qRT-PCR analysis of
Ctrl adKI Ctrl adKI 0 15 30 60 90 120 Ctrl adKI thermogenic genes expression by inhibition of Mig-6 in BAT cell treated with 20 μM FSK. FSK, Foskolin is
C 200 Ctrl E min commonly used as a way to enchance cAMP levels, mimicking thermogenesis stimuli.
adKI 120 Ctrl 600
adKI
Lipid Level (mg/dl) 100 Glucose (mg/dL) 80 AUC(mg/dL.min) 400 SUMMARY & CONCLUSION
100
150
60
40
200
50
0 20 0 *** 0 Deletion of Mig-6 decreases UCP1 expression in the brown adipocytes.
HDL LDL CHO TG 0 15 30 60 90 120 Ctrl adKI BKI mice ameliorates glucose metabolism and insulin sensitivity and activates thermogenesis in BAT.
min
(A) Body weight. (B) Fasting blood glucose levels (C) Serum lipid levels. (D)Glucose tolerance test (GTT); Mig-6 controls cAMP-PKA signaling-induced expression of the UCP1.
glucose (2 g/kg body weight) was injected into overnight-fasted mice. Area under the curve (AUC) for GTT. Deletion of Mig-6 restrains differentiation in the brown adipocytes.
(E) Insulin tolerance test (ITT). i.p. injection of human regular insulin (0.75 U/kg) in mice fasted for 4 hours.
Area under the curve (AUC) for ITT. Mig-6 regulates glucose homeostasis and thermogenesis in BAT.

