
Page 5 - R. Organoid
P. 5
Three-dimensional reconstitution of bladder assembloids that structurally
and functionally recapitulate in vivo tissue regeneration and cancer
Eunjee Kim, Sungeun Kim, Seoyoung Choi, Yubin Kim, and Kunyoo Shin*
Department of Life Sciences, Pohang University of Science and Technology, Pohang, Gyeongbuk 37673, South Korea
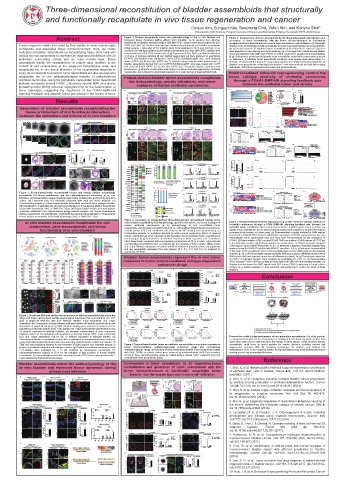
Abstract Figure 3. Bladder assembloids mimic the pathophysiology of the in vivo bladder and Figure 6. Development of tumor assembloids by 3D bioprinting-based reconstitution and
represent tissue dynamics during urinary tract infection. (a, b) Sections from wild-type
bladders (a) and bladder assembloids (b) 3 days after UPEC infection were immunostained for p63, generation of tumor assembloids with the tumor microenvironment to functionally
recapitulate tumor invasion into the muscle layer and immune cell infiltration. (a) Schematic
Current organoid models are limited by their inability to mimic mature organ Ck20, and Upk3. (c) Sections from wild-type bladders (upper panels) and bladder assembloids diagram of the 3D bioprinting-based reconstitution process to generate bladder tumor assembloids.
architecture and associated tissue microenvironment. Here, we create (lower panels), 7 days after UPEC infection were immunostained for Ck18 and AmCyan. (d, e) (b, c) Sections from the 3D bioprinted tumor assembloids derived from the P-1 (b) or P-3 (c) lines
multi-layered bladder assembloids by reconstituting tissue stem cells with Sections from wild-type bladders (d) and bladder assembloids (e) 3 days after UPEC infection were were analyzed by H&E staining and immunostaining. (d, e) 3D bioprinted, patient-derived bladder
immunostained for Ck5, Ck18 and vimentin. (f, g) Expression of Gli1, Wnt2, and Wnt4 in epithelium
tumor assembloids treated with SAG, FK506, or vehicle control were analyzed by immunostaining.
various stromal components to represent an organized architecture with an or stroma of wild-type bladders (f) and bladder assembloids (g) were analyzed by quantitative (f, g) 3D bioprinted, patient-derived bladder tumor assembloids treated with cisplatin were analyzed
epithelium surrounding stroma and an outer muscle layer. These RT-PCR. (h) Bladders from TM-injected Ck5CreERT2; R26Rainbow/WT mice were analyzed by caspase 3. (h) Bladder tumor assembloids containing outer muscle layer derived from P-7
assembloids exhibit the characteristics of mature adult bladders in the before (UPEC day 0) and after (UPEC day 7) bacterial injury using four-color fluorescence. (i) (luminal, T1 stage) and P-3 (basal, T2 stage) organoid lines were analyzed by immunostaining. (i)
Bladder assembloids derived from Ck5CreERT2;R26Rainbow/WT mice were treated with 4-OHT
Bladder tumor assembloids containing tumor-reactive T cells were analyzed by bright field imaging
context of cell compositions at the single-cell transcriptome level, and and analyzed before (UPEC day 0) and after (UPEC day 7) bacterial injection using four-color (left panels; dotted lines represent tumor areas) and immunostaining.
recapitulate the in vivo tissue dynamics of the regenerative response to fluorescence. (j) Model for clonal relationship during UTI-induced urothelial regeneration. Urothelial
injury. As a malignant counterpart, tumor assembloids are also developed to regeneration was achieved by oligoclonal expansion of a small number of basal epithelial cells. FOXA1-mediated enhancer reprogramming confers the
recapitulate the in vivo pathophysiological features of patient-derived Patient-derived bladder tumor assembloids recapitulate tumor subtype plasticity of urothelial carcinomas
urothelial carcinomas. Using the genetically manipulated tumor assembloid the histopathology, genetic alterations, and tumor through a FOXA1-BMP-HH signaling feedback axis
platform, we identify tumoral FOXA1, induced by stromal BMP, as a master subtypes of human urothelial carcinomas between the epithelial tumor and stroma
pioneering factor driving enhancer reprogramming for the determination of
tumor phenotype, suggesting the importance of the FOXA1–BMP–HH a P-1 (Luminal) b P-2 (Basal) a GAIN regions (n= 22,698) b GAIN regions 3' UTR c 1200 GAIN regions d FOXA1
signaling feedback axis between tumor and stroma in the control of tumor Tumor organoid Tumor assembloid Xenograft Parental tumor Tumor organoid Tumor assembloid Xenograft Parental tumor L1 (0.9%) 5' UTR (3.4%) 900 KLF5 SP1 0.8 ****
●
ZNF263
L2
1.75 Exon (4.1%) ● ● SP2 FOXC2 FOXD2 0.6
B1 0.00 Intergenic Intergenic − log 10 q−value 600 ● ● ● ● ● ● ● ● ● ● ● ● ● ● ● ● ● ● ● ● ● ● ● ● ● ● ● ● SP3 FOXL1 FOXA1 Foxa2 Relative Gene Expression (FOXA1/HPRT) 0.4
(32.6%)
Results H&E H&E B2 ATAC-seq tag density (center +/- 5kb) (39.3%) (39.3%) Non−coding 300 ● ● ● ● ● ● ● ● ● ● ● ● ● ● ● ● ● ● ● ● ● ● ● ● ● ● ● ● ● ● ● ● ● ● ● ● ● ● ● ● ● ● ● ● ● ● ● ● ● ● ● ● ● ● ● ● ● ● ● ● ● ● ● ● ● ● ● ● ● ● ● ● ● ● ● ● ● ● ● ● ● ● ● ● ● ● ● ● ● ● ● ● ● ● ● ● ● ● ● ● ● ● ● ● ● ● ● ● ● ●● ● ● ● ● ● ● ●●● ● ● ● ● ● ● ● ● ●● ●● ● ● ● ● ● ● ● ● ●● ● ● ● ● ●● ● ● ● ● ● ●● ● ● ● ● ● ● ●● ●
Intron
(32.6%)
Intron
(1.4%)
Promoter−TSS
(16.7%)
CK18 CK18/vimentin/GFP CK18/vimentin/CD31CK18/vimentin/CD31 CK5 CK5/vimentin/GFP CK5/vimentin/CD31 CK5/vimentin/CD31 TTS (1.7%) 0 JASPAR 2018 (n=1,404) 0.0 B1 B2 L1 L2
Generation of bladder assembloids recapitulating the e B1 FOXA1 B2 f B1 5 5 1Kb g GO:0048732: gland development
GO:0048568: embryonic organ development
GO:0070848: response to growth factor
GO:0030324: lung development
tissue architecture of and functional interaction ATAC-seq B2 L1 5 GO:0061458: reproductive system development
GO:0030855: epithelial cell differentiation
GO:0001501: skeletal system development
GO:0007389: pattern specification process
between the epithelium and stroma of in vivo bladders Immunostaining Immunostaining L1 L2 L2 5 4 h 0 2 4 6 −log10(P) 8 10 12 14 GO:0001503: ossification
GO:1905114: cell surface receptor signaling pathway
involved in cell−cell signaling
a b FOXA1 ChIP-seq B1 B2 4 4 B1
Day 10 Day 54 Day 109 Day 169 Day 269 Day 338 Long-term (day 81) organoid L1 1 0.5 B2
H&E Ck5/p63 Ck14/Ck18 Upk3 Ck20 L2 4 0 −0.5 −1 B1/FOXA1 o.e tumor
c d CTGF GAIN FAP ALOX5AP TBX2 CAVIN3 TRAK1 MT1X GPD1L GLIPR1 PRRX1 PALLD MSN SNAI2 CYP2J2 PDGFC TUBB6 ADIRF AHNAK2 KRT5 CHST15 GAREM1 CD44 SEMA5A EMP3 MT2A GATA3 SCNN1B UPK2 UPK1A SCNN1G TOX3 FAM174B TWIST1 CYP4B1 PLEKHG6 VGLL1 FLNC CLDN3 KRT20 FBP1 PPFIBP2 SPINK1 BHMT HMGCS2 TMEM97 FOXA1 KRT8 SLC27A2 CDK6 CAPN5 TMPRSS2 FGFR3 RAB15 RNF128
Bright field Tumor organoid Tumor assembloid Xenograft Parental tumor Tumor organoid Tumor assembloid Xenograft Parental tumor i ATAC-seq GAIN regions (n=2) j 0.4 GAIN genes 0.3 Cell differentiation
P-3 (Basal)
P-6 (Luminal)
signature genes
Long-term organoid H&E Ck5/p63 Adult (p8 week) bladder Upk3 Ck20 H&E H&E 1.0 0.8 0.6 0.4 p = 0.00 0.6 FOXA1 ChIP-seq Basal Basal/ 0.3 0.2 0.1 0.0 NES=1.69 0.2 0.1 0.0 −0.1 NES=1.35
p=0.00
p=0.002
p = 0.00
0.5
Ck14/Ck18
FOXA1 o.e
0.4
tumor
0.3
Ck5/Ck18 CK5 CK5/vimentin/GFP CK5/vimentin/CD31 CK5/vimentin/CD31 CK18 CK18/vimentin/GFP CK18/vimentin/CD31CK18/vimentin/CD31 0.2 -1Kb peak center 1Kb 0.2 0.1 -1Kb peak center 1Kb Basal/ FOXA1 o.e tumor avg Basal avg Basal/ FOXA1 o.e tumor avg Basal avg
k l m Cell differentiation
GAIN regions (n=2) 0.1 GAIN genes NES=-1.6 0.1 signature genes NES=-1.31
ATAC-seq
FOXA1 ChIP-seq
Luminal/
c d Bladder assembloid f Human bladder assembloid Immunostaining Immunostaining 1 0.5 0 −0.5 −1 L1 L2 L1/FOXA1 k.o tumor 1.0 0.8 p < 0.01 0.6 0.5 0.4 p = 0.00 Luminal 0.0 −0.1 −0.2 −0.3 p=0.00 0.0 −0.1 −0.2 p=0.005
FOXA1 k.o
Three-layered bladder assembloid 60 *** ** 20 L2/FOXA1 k.o tumor 0.6 0.3 tumor −0.3
Bladder assembloid H&E Ck5/vimentin/α-SMA 40 15 * * FAP ALOX5AP PDGFC TBX2 CYP2J2 CD14 CHST15 GATA3 SEMA5A SCNN1B EMP3 GAREM1 KRT5 CD44 MT2A AHNAK2 TUBB6 PALLD ADIRF SNAI2 MSN UPK2 GLIPR1 GPD1L CAVIN3 TRAK1 GDPD3 MT1X TOX3 SCNN1G TWIST1 UPK1A FAM174B PRRX1 CYP4B1 FBP1 SPINK1 CLDN3 BHMT CAPN5 FLNC VGLL1 CDK6 RNF128 SLC9A2 PPARG PLEKHG6 FGFR3 KRT8 RAB15 SLC27A2 TMPRSS2 TMEM97 HMGCS2 FOXA1 KRT20
Mitotic index (%) 20 * * Mitotic index (%) 10 5 ** ** n o -1Kb peak center 1Kb -1Kb peak center 1Kb FOXA1 k.o tumor avg FOXA1 k.o tumor avg
0 DMSO Vis SAG DMSO Vis SAG 0 DMSO Vis SAG DMSO Vis SAG 0.3 * 0.4 *** B1 3 ATAC-seq 1Kb 4 FOXA1 ChIP-seq 1Kb
Merge Ck5 vimentin α-SMA Epithelium Stroma Epithelium Stroma e f i P-1 (Luminal) 0.2 0.3 3 4
Ck5/p63 Ck14/Ck18 Upk3 Ck20 e P-1 a b c a b c P-2 a b c P-3 a b c P-6 100 P-1 P-2 P-3 P-6 Late organoid (p15) Late assembloid (p15) Parental tumor Relative Gene Expression (FOXA1/HPRT) 0.2 B2
L L L L Human bladder organoids TP53 80 6 0.4 2.5 2.0 0.1 BMP o.e CAF B1/ 3 4
Bright field H&E CK5/CK18 Missense 4 0.3 1.5 0.1 3 4
KMT2D 0.2 B2/
KMT2C Insertion Tumor mutations (%) 60 2 0.1 1.0 0.5 0.0 B1 B1/ BMP o.e 0.0 B2 B2/ BMP o.e BMP o.e CAF GAIN FGB GAIN FGB
FAT1 Deletion 40 0 0.0 0.0 CAF CAF
HRAS 20 UPK1A UPK2 ERBB2 FOXA1 GATA3 KRT5 KRT14 CDH3 KRT6A UPK1A UPK2 ERBB2 FOXA1 GATA3 KRT5 KRT14 CDH3 KRT6A UPK1A UPK2 ERBB2 FOXA1 GATA3 KRT5 KRT14 CDH3 KRT6A p q
Wild-type bladder ELF3 0 j P-2 (Basal) 0.8 **** 0.5 **** 3 ATAC-seq 1Kb 4 FOXA1 ChIP-seq 1Kb
Wild-type bladder H&E Ck5/vimentin/α-SMA Human three-layered bladder assembloid RHOB a b a b a b a b Late organoid (p11) Late assembloid (p11) Parental tumor 0.6 0.4 L1
Bright field H&E CK5/vimentin/α-SMA a) Tumor organoid Organoid/assembloid only 20 5 5 0.3 L2 3 4
CDKN2A 15 4 4 Relative Gene Expression (FOXA1/HPRT) 0.4
HIST1H3A b) Tumor assembloid Parental tumo r only 10 3 2 3 2 0.2 0.2 BMP k.o CAF L1/ 3 4
Concordant
ERBB3 5 1 1 0.1 L2/ 3 4
CDKN1A g 0 0 0 0.0 L1 L1/ 0.0 L2 L2/ BMP k.o CAF
Merge Ck5 vimentin α-SMA P-1 P-2 P-3 P-6 UPK1A UPK2 ERBB2 FOXA1 GATA3 KRT5 KRT14 CDH3 KRT6A UPK1A UPK2 ERBB2 FOXA1 GATA3 KRT5 KRT14 CDH3 KRT6A UPK1A UPK2 ERBB2 FOXA1 GATA3 KRT5 KRT14 CDH3 KRT6A BMP k.o BMP k.o GAIN FGB GAIN FGB
Merge CK5 vimentin α-SMA USP28 100 k CAF CAF
P-3 (Basal)
Figure 1. Three-dimensionally reconstituted mouse and human bladder assembloids RB1 80 Assembloid only Late organoid (p11) Late assembloid (p11) Parental tumor r s ATAC-seq GAIN regions (n=2) v Basal
recapitulate the tissue architecture and the epithelial–stromal interaction of in vivo RBM10 60 Organoid only 10 8 40 30 10 8 1 B1/BMP o.e CAF 1.0 p = 0.00 0.6 FOXA1 ChIP-seq Basal/ Tumor
p = 0.00
RXRA
bladders. (a) Representative images of bladder organoids at indicated time points during long-term PARD3 Tumor mutations (%) 40 Concordant 6 4 20 10 6 4 0.5 0 −0.5 −1 B2/BMP o.e CAF 0.8 0.6 0.5 0.4 BMP o.e CAF Low HH Low BMP
Basal/
B1/BMP o.e CAF-FOXA1 k.o tumor
BMP o.e CAF-
B2/BMP o.e CAF-FOXA1 k.o tumor
culture. (b) Long-term (day 81) organoids compared with adult (p8 week) bladders. (c) KMT2A 20 2 0 0 2 0 FAP ALOX5AP TRAK1 CAVIN3 GDPD3 UPK2 GPD1L MT1X TBX2 GATA3 ADIRF SCNN1B GLIPR1 GAREM1 TUBB6 AHNAK2 FAM174B PALLD MSN KRT5 SNAI2 CD44 EMP3 SEMA5A MT2A CYP2J2 CHST15 PLEKHG6 PDGFC SCNN1G UPK1A TOX3 RNF128 CYP4B1 PRRX1 FBP1 KRT8 TMPRSS2 FGFR3 FLNC RAB15 BHMT SLC27A2 SLC9A2 PPARG CDK6 CAPN5 SPINK1 CLDN3 TM
Representative images of a three-layered bladder assembloid compared with a wild-type bladder. SF1 0 UPK1A UPK2 ERBB2 FOXA1 GATA3 KRT5 KRT14 CDH3 KRT6A UPK1A UPK2 ERBB2 FOXA1 GATA3 KRT5 KRT14 CDH3 KRT6A UPK1A UPK2 ERBB2 FOXA1 GATA3 KRT5 KRT14 CDH3 KRT6A t 0.2 -1Kb peak center 1Kb 0.1 -1Kb peak center 1Kb FOXA1-mediated
(d) Quantification of epithelial and stromal cell proliferation in three-layered bladder assembloids ARID1A h P-1 P-2 P-3 P-6 l Late organoid (p12) P-6 (Luminal) Parental tumor u GAIN regions (n=2) reprogramming
enhancer
PIK3CA
Late assembloid (p12)
treated with Vismodegib, SAG, or DMSO for 7 days. (e) Representative images of human bladder ERBB2 Parental tumor 2.0 1.5 0.6 2.5 2.0 1 0.5 L1/BMP k.o CAF 1.0 ATAC-seq p < 0.001 FOXA1 ChIP-seq Luminal
L2/BMP k.o CAF
p = 0.00
organoids established from patient-derived benign bladder samples and human three-layered CREBBP Late organoid 1.0 0.4 0.2 1.5 1.0 0 −0.5 −1 L1/BMP k.o CAF-FOXA1 o.e tumor 0.8 0.5 0.4 Luminal/ Tumor BMP
BMP k.o CAF
L2/BMP k.o CAF-FOXA1 o.e tumor
Luminal/
bladder assembloids. (f) Quantification of epithelial and stromal cell proliferation in three-layered a) Parental tumor Late assembloid 0.5 0.0 0.0 0.5 0.0 FAP ALOX5AP TOX3 GPD1L FAM174B TBX2 UPK2 GDPD3 GLIPR1 TRAK1 CAVIN3 CD14 MT1X CYP2J2 PALLD GATA3 ADIRF TUBB6 MSN CHST15 SCNN1B AHNAK2 SNAI2 KRT5 SEMA5A PDGFC MT2A GAREM1 CD44 EMP3 PRRX1 UPK1A SCNN1G CYP4B1 TWIST1 FBP1 CAPN5 VGLL1 CLDN3 KRT20 CDK6 FGFR3 KRT8 TMPRSS2 SLC
FOXA1 o.e tumor
b) Tumor organoid
human bladder assembloids treated with Vismodegib, SAG, or DMSO for 7 days. c) Tumor assembloid Basal Luminal UPK1A UPK2 ERBB2 FOXA1 GATA3 KRT5 KRT14 CDH3 KRT6A UPK1A UPK2 ERBB2 FOXA1 GATA3 KRT5 KRT14 CDH3 KRT6A UPK1A UPK2 ERBB2 FOXA1 GATA3 KRT5 KRT14 CDH3 KRT6A 0.2 -1Kb peak center 1Kb 0.2 0.1 -1Kb peak center 1Kb HH HH CAF BMP
Figure 4. Generation of patient-derived, three-dimensionally reconstituted bladder tumor
In vitro bladder assembloids recapitulate the cell assembloids recapitulating the histopathology, genomic alterations, and tumor subtypes of Figure 7. FOXA1-mediated enhancer reprogramming confers the tumor subtype plasticity of
urothelial carcinomas through a FOXA1-BMP-HH signaling feedback axis between the
composition, gene transcriptome, and tissue human urothelial carcinomas. (a, b) Histopathology of four reconstituted tumor epithelial tumor and stroma. (a) Heatmap representation of GAIN regions based on ATAC-seq
assembloids—two luminal (a, d) and two basal (b, c)—with matched patient-derived cancer-associ-
functionality of in vivo bladders ated fibroblasts (CAF) and endothelial cells analyzed by H&E staining and immunostaining. (e) signals in four assembloids. (b) Pie chart showing the genomic annotations of 22,698 GAIN regions
Comparative analysis for mutations detected by whole exome sequencing (WES) of parental according to the location of a given peak. (c) Representation of motifs enriched at GAIN regions
a b tumors, patient-derived tumor organoids at late passages, and reconstituted tumor assembloids at based on the JASPAR 2018 database. (d) Relative expression of FOXA1 in indicated four lines. (e)
Wild-type bladder 1-day bladder assembloid 7-days bladder assembloid 100 late passages. (f, g) Concordance of mutations detected in tumor organoids and reconstituted Reconstituted tumor assembloids from four lines were immunostained for the expression of
B2 C4 tumor assembloids compared with corresponding parental tumors (f) or in tumor organoids and FOXA1. (f) Representative ATAC-seq and FOXA1 ChIP-seq profiles of GAIN regions at CTGF loci
A3 C1 Epithelial cells 75 Epithelial cells in the indicated samples. (g) Pathway analysis for nearby genes of FOXA1-occupied intergenic
A4 B6 Stromal fibroblasts Stromal fibroblasts corresponding reconstituted tumor assembloids (g). (h) Summary of tumor subtype drifting shown
B3 C3 Smooth muscle cells Smooth muscle cells
A5 A7 A0 B4 C8 Endothelial cells Proportion of cells (%) 50 Endothelial cells (mouse) in (i-l). (i-l) Relative expressions of luminal and basal markers in parental tumors, late organoids, GAIN regions, which yielded 689 genes. (h, k, r, t) Molecular subtypes of indicated samples were
Schwann cells
Endothelial cells (human)
A6 A2 B0 C2 C0 Macrophages Schwann cells and late assembloids generated from four patients (P-1, P-2, P-3, and P-6) as analyzed by analyzed using the BASE47 together with MDACC classifiers. (i, l, s, u) Metagene representation
Macrophages
Mesothelial cells
B1 Others (cycling cells) 25 Mesothelial cells of the mean ATAC-seq (left) or FOXA1 ChIP-seq (right) signal across GAIN regions in the indicated
C9 Others (cycling cells) quantitative RT-PCR.
A8 A1 B5 C6 C7 C5 samples. (j, m) GSEA of averaged indicated samples RNA-seq to assess differential enrichment of
0 WT 1−day 7−days GAIN genes (left) and signature genes for cell differentiation (right). (n, p) The relative expression
c d Bladder tumor assembloids represent the in vivo tumor of FOXA1 in indicated samples were analyzed by quantitative RT-PCR. (o, q) Representative
Epithelial Stromal Smooth Endothelial Schwann Macro- Sample Epithelial Stromal Smooth Endothelial response to tumor stroma mediated, subtype-dependent
cells fibroblasts muscle cells cells cells phages cells fibroblasts muscle cells cells ATAC-seq and FOXA1 ChIP-seq profiles of GAIN regions at FGB loci in the indicated samples. (v)
Ly6d Dcn Acta2 Cldn5 Plp1 Tyrobp ● WT Ly6d Dcn Acta2 Cldn5
Upk3a Col1a1 Cald1 Tm4sf1 Mpz Fcer1g ● 1d ● 7d Upk3a Col1a1 Cald1 Tm4sf1 anticancer drugs Graphical model shows that BMP signals from CAF induce FOXA1 expression in tumor cells to
Wfdc2 Col1a2 Myl9 Pecam1 Sostdc1 Cd52 Wfdc2 Col1a2 Myl9 Pecam1
Gstm1 Fbln1 Tpm2 Aqp1 Art3 Coro1a Avg_exp Gstm1 Fbln1 Tpm2 Aqp1 function as a master regulator to drive enhancer reprogramming to confer the tumor subtype
Gsta4 Col3a1 Myh11 Ptprb Sfrp5 Laptm5 0 Gsta4 Col3a1 Myh11 Ptprb
Krt18 Gsn Rrad Ly6c1 Gpr37l1 Ctss 1 Krt18 Gsn Rrad Ly6c1 avg 5 a b plasticity.
Sprr1a Clec3b Crip1 Ctla2a Kcna2 Ccl6 2 3 Sprr1a Clec3b Crip1 Ctla2a 4 Control SAG FK506 P-1 (Luminal) Control SAG FK506 P-2 (Basal)
Upk1a Fmo2 Gm13889 Cavin2 Kcna1 Cytip 4 Upk1a Fmo2 Gm13889 Cavin2 3 2 4000 Tumor growth 2000 Tumor growth
Foxq1 Lum Tagln Flt1 Cadm4 Ptprc Foxq1 Lum Tagln Flt1 1 Control Control
Krt15 Pi16 Des Egfl7 Ncam1 Alox5ap pct Krt15 Pi16 Des Egfl7 3000 SAG 1500 ** **** SAG Conclusion
Ivl Bgn Gadd45b Ly6e Chl1 Wfdc17 ● 0 Ivl Bgn Gadd45b Ly6e Tumor organoid CK18 FK506 Tumor organoid CK5 **** FK506
Sprr2a3 Sparc Tpm1 Emcn S100b Ccl9 ● 25 Sprr2a3 Sparc Tpm1 Emcn Total number of tumor cells 2000 Total number of tumor cells 1000
Krt19 Nbl1 Mustn1 Cd93 Gatm Cybb ● 50 Krt19 Nbl1 Mustn1 Cd93 1000 500
Krt8 Mgp Mylk Plvap Lgi4 Cd53 ● 75 Krt8 Mgp Mylk Plvap
Krt7 Mfap4 Rasl11a Cdh5 Cdh19 F13a1 ● 100 Krt7 Mfap4 Rasl11a Cdh5 0 0
WT 1d 7d WT 1d 7d WT 1d 7d WT 1d 7d WT 1d 7d WT 1d 7d 1d 7d 7d WT 1d 7d 7d WT 1d 7d 7d WT 1d 7d 7d WT Tumor assembloid CK18/vimentin Tumor organoid Tumor assembloid Tumor assembloid CK5/vimentin Tumor organoid Tumor assembloid Tissue Patient-derived Cancer-associated
B2 C3 C2 A0 B1 C1 C4 A1 B0 C0 C5 A2 B4 C6 C7 A3 fibroblasts Stromal fibroblasts fibroblasts fibroblasts (CAF)
e f Adult Adult Primary Cancer
Bladder assembloid Wild-type bladder Bladder assembloid Normal organoids Tumor organoids
Bright field α-SMA/phalloidin/DAPI Muscle cell TEM ZO-1/DAPI TEM ZO-1/DAPI c P-3 (Basal) d P-6 (Luminal) tissues stem cells cancer cells patients
80 contraction TJ L L TJ L L Control SAG FK506 Tumor growth Control SAG FK506 Tumor growth iPSC Smooth muscle cells 3D bioprinting 3D bioprinting Smooth muscle cells Patient-specific
**** ****
iPSC
Endothelial cells
Endothelial cells
Muscle cell length (μm) 40 Tumor organoid CK5 **** FK506 Tumor organoid CK18 FK506
Ctrl 60 UP TJ UP 2000 1500 *** **** Control SAG 8000 6000 Control SAG Immune cells Activated T cells
Merge α-SMA phalloidin 20 Total number of tumor cells 1000 Total number of tumor cells 4000 Normal assembloid Tumor assembloid
Ctrl Ach NE
+Ach 0 Muscle layer g Bladder assembloid h bladder assembloid i Human bladder assembloid Tumor assembloid CK5/vimentin 500 0 Tumor organoid Tumor assembloid Tumor assembloid CK18/vimentin 2000 0 Tumor organoid Tumor assembloid
Human
- Ca 2+
+ Ca 2+
contraction
Diameter of assembloid (mm) 1.0 FITC-dextran/DAPI ZO-1/DAPI FITC-dextran/DAPI e P-1 (Luminal) f P-2 (Basal)
Merge α-SMA phalloidin 2.0 1.5 ** *** L - Ca 2+ L + Ca 2+ L L L
+NE 0.5 Cisplatin Gemcitabine Mitomycin C Cisplatin Gemcitabine Mitomycin C
Merge α-SMA phalloidin 0.0 Ctrl Ach NE 100 80 100 80 100 80 100 80 100 80 100 80
Figure 2. Single-cell RNA-seq and functional analyses of bladder assembloid maturity at the Viability (%) 60 40 Viability (%) 60 40 Viability (%) 60 40 Viability (%) 60 40 Viability (%) 60 40 Viability (%) 60 40
single-cell transcriptome level and the physiological functions of in vivo bladders. (a) t-SNE 20 0 20 0 20 0 20 0 20 0 20 0 Bioreactor Bioreactor
plots of single-cell RNA-seq data from wild-type bladder, 1-day assembloid, and 7-days -1.0 Log [concentration (μM)] 1.0 1.5 2.0 -1.0 Log [concentration (μM)] 1.0 1.5 2.0 -1.0 Log [concentration (μM)] 1.0 1.5 2.0 -1.0 Log [concentration (μM)] 1.0 1.5 2.0 -1.0 Log [concentration (μM)] 1.0 1.5 2.0 -1.0 Log [concentration (μM)] 1.0 1.5 2.0
0.0
0.5
0.0
0.5
-0.5
0.5
-0.5
0.0
-0.5
0.0
0.5
0.0
0.0
0.5
0.5
-0.5
-0.5
-0.5
assembloid. (b) Comparative analysis between wild-type bladder and bladder assembloids for the Tumor organoid Tumor organoid
Tumor assembloid
Tumor assembloid
proportions of individual cell types. (c) Split dot plots showing gene expressions between shared g P-3 (Basal) h P-6 (Luminal)
populations in wild-type bladder (red), 1-day (green) and 7-days (blue) bladder assembloids for top 100 Cisplatin 100 Gemcitabine 100 Mitomycin C 100 Cisplatin 100 Gemcitabine 100 Mitomycin C Modeling for various diseases
15 markers expressed in wild-type bladder. (d) Heatmap representation of gene expression 80 60 80 60 80 60 80 60 80 60 80 60 Establishment of in vitro platform for high-throughput drug screening/repositioning
Development of precise and personalized therapy
between clusters in four individual cell populations of wild-type bladder (WT), 1-day assembloid Viability (%) 40 20 Viability (%) 40 20 Viability (%) 40 20 Viability (%) 40 20 Viability (%) 40 20 Viability (%) 40 20
(1d), and 7-days assembloid (7d) for top 15 markers expressed in wild-type bladder. (e) 0 -1.0 Log [concentration (μM)] 1.0 1.5 2.0 0 -1.0 Log [concentration (μM)] 1.0 1.5 2.0 0 -1.0 Log [concentration (μM)] 1.0 1.5 2.0 0 -1.0 Log [concentration (μM)] 1.0 1.5 2.0 0 -1.0 Log [concentration (μM)] 1.0 1.5 2.0 0 -1.0 Log [concentration (μM)] 1.0 1.5 2.0 Prospective model for the development of next-generation assembloids. Our study provides
0.0
0.5
0.0
-0.5
0.5
-0.5
-0.5
0.0
0.0
0.5
0.5
-0.5
0.5
0.0
-0.5
-0.5
0.5
0.0
Three-layered bladder assembloids treated with acetylcholine or norepinephrine were analyzed Tumor organoid Tumor organoid a conceptual framework for the development of multilayered, functional organoids derived from
using bright field images (left panels) and immunostaining (right panels) for α-SMA and vimentin. (f) Tumor assembloid Tumor assembloid tissue stem cells or tumor cells that mimic the biology of native tissues. These miniature tissues,
TEM and immunostaining analysis for the formation of tight junctions and urothelial plaques in Figure 5. Reconstituted bladder tumor assembloids represent the in vivo tumor response to assembloids, could serve as model systems for various diseases, including cancers and
bladder assembloids compared with wild-type bladder. (g) Bladder assembloids microinjected with tumor stroma-mediated, subtype-dependent anticancer drugs and conventional degenerative diseases. With 3D bioprinting technology, this platform may facilitate the
FITC-dextran were incubated for 3 h and analyzed by fluorescence microscopy. (h) chemotherapeutic drugs. (a-d) Patient-derived reconstituted bladder tumor assembloids treated establishment of an in vitro organoid system for high-throughput drug screening/repositioning to
Immunohistochemical analysis of ZO-1 for the formation of tight junctions in human bladder with SAG, FK506, or vehicle control were analyzed by immunostaining. (e-h) Dose-response develop precise and personalized therapies.
assembloids. (i) Human bladder assembloids microinjected with FITC-dextran were incubated for 3 curves to three chemotherapeutic drugs for patient-derived bladder tumor organoids (red) and
h and analyzed by fluorescence microscopy. reconstituted tumor assembloids (blue). Reference
Bladder assembloids mimic the pathophysiology of the Development of tumor assembloids by 3D bioprinting-based
in vivo bladder and represent tissue dynamics during reconstitution and generation of tumor assembloids with the 1. Shin, K. et al. Hedgehog/Wnt feedback supports regenerative proliferation
urinary tract infection tumor microenvironment to functionally recapitulate tumor of epithelial stem cells in bladder. Nature 472, 110-114, doi:10.1038/na-
invasion into the muscle layer and immune cell infiltration ture09851 (2011).
a Wild-type bladder b Bladder assembloid c 7 days after 2. Shin, K. et al. Hedgehog signaling restrains bladder cancer progression
(3 days after UPEC instillation) (3 days after UPEC microinjection) UPEC instillation/microinjection a b c
PBS UPEC PBS UPEC UPEC/Ck18 UPEC 3D bioprinting Bladder tumor organoid P-1 (Luminal) P-3 (Basal) by eliciting stromal production of urothelial differentiation factors. Cancer
Patient-derived CAF Tumor organoid Tumor assembloid Tumor organoid Tumor assembloid
Endothelial cells
p63/Ck20 p63/Ck20 Wild-type bladder H&E H&E Cell 26, 521-533, doi:10.1016/j.ccell.2014.09.001 (2014).
CK18 CK18/vimentin/CD31 CK5 CK5/vimentin/CD31 3. Shin, K. et al. Cellular origin of bladder neoplasia and tissue dynamics of
its progression to invasive carcinoma. Nat Cell Biol 16, 469-478,
Upk3 Upk3 Bladder assembloid doi:10.1038/ncb2956 (2014).
d e f Immunostaining Immunostaining 4. Kim, S. et al. Epigenetic regulation of mammalian Hedgehog signaling to
the stroma determines the molecular subtype of bladder cancer. Elife 8,
Wild-type bladder Bladder assembloid Wild-type bladder
(3 days after UPEC instillation) (3 days after UPEC microinjection) Epithelium Stroma
PBS UPEC Epithelial cells PBS UPEC 50 Epithelial cells 0.15 PBS PBS d P-1 (Luminal) f P-1 (Luminal) doi:10.7554/eLife.43024 (2019).
Ck5/Ck18/vimentin Mitotic index (%) 30 20 ** Ck5/Ck18/vimentin Mitotic index (%) 40 30 20 ** Relative Gene Expression 0.10 0.05 UPEC ** UPEC ** * Tumor organoid CK18 Control SAG FK506 3000 Tumor growth Control Tumor organoid Control Cisplatin 40 30 Tumor apoptosis *** Tumor organoid 5. Lancaster, M. A. & Knoblich, J. A. Organogenesis in a dish: modeling
40
development and disease using organoid technologies. Science 345,
SAG
Tumor assembloid
0 10 PBS UPEC 10 0 PBS UPEC 0.00 Gli1 Wnt2 Wnt4 Gli1 Wnt2 Wnt4 Total number of tumor cells 2000 1000 FK506 caspase 3 Apoptotic index (%) 20 1247125, doi:10.1126/science.1247125 (2014).
Ki67/DAPI 40 Stromal cells Ki67/DAPI 25 Stromal cells g Bladder assembloid Tumor assembloid CK18/vimentin 0 Tumor organoid Tumor assembloid Tumor assembloid caspase 3 10 0 Control Cisplatin 6. Dutta, D., Heo, I. & Clevers, H. Disease modeling in stem cell-derived 3D
393-410,
Mol
Med
organoid
Trends
systems.
23,
**
*
Mitotic index (%) 30 20 Mitotic index (%) 20 15 10 0.15 0.10 PBS UPEC Epithelium PBS UPEC Stroma *** e g doi:10.1016/j.molmed.2017.02.007 (2017).
Ki67 10 Ki67 5 Relative Gene Expression Control SAG FK506 P-3 (Basal) Tumor growth Control Cisplatin P-3 (Basal) Tumor apoptosis 7. Robertson, A. G. et al. Comprehensive molecular characterization of
0 0 0.05 **** **** 2000 25 ****
PBS UPEC PBS UPEC 0.00 Tumor organoid 1500 Control Tumor organoid caspase 3 20 Tumor organoid muscle-invasive bladder cancer. Cell 171, 540-556 e525, doi:10.1016/j.-
SAG
Tumor assembloid
Gli1 Wnt2 Wnt4 Gli1 Wnt2 Wnt4 CK5 Total number of tumor cells 1000 **** **** **** FK506 Apoptotic index (%) 15 cell.2017.09.007 (2017).
h Bladder from i Bladder assembloid from j 500 10 5
Ck5 CreERT2 ;R26 Rainbow/WT Ck5 CreERT2 ;R26 Rainbow/WT 0 Tumor organoid Tumor assembloid 0 8. Choi, W. et al. Identification of distinct basal and luminal subtypes of
UPEC day 0 UPEC day 7 UPEC day 0 UPEC day 7 Tumor assembloid CK5/vimentin Tumor assembloid caspase 3 Control Cisplatin muscle-invasive bladder cancer with different sensitivities to frontline
Normal urothelium Clonal expansion of h Bladder tumor assembloid containing outer muscle layer i Bladder tumor assembloid containing tumor-reactive T cells chemotherapy. Cancer Cell 25, 152-165, doi:10.1016/j.ccr.2014.01.009
basal epithelial cells
EGFP/mCh/mOr/mCe EGFP/mCh/mOr/mCe A M P-7 (T1 stage) A M P-3 (T2 stage) Muscle invasion -T cells Bright field Ck5/CD8/vimentin caspase 3 0.5 0.4 0.3 Tumor size Tumor apoptosis (2014).
100
***
***
100
****
9. Lee, S. H. et al. Tumor evolution and drug response in patient-derived
80
80
60
60
Bacterial infection
Umbrella cell exfoliation
e / S - α n i t n / S - α n i t n e Muscle invasiveness (%) 40 20 Tumor area (mm 2 ) 0.2 0.1 Apoptotic index (%) 40 20 organoid models of bladder cancer. Cell 173, 515-528 e517, doi:10.1016/j.-
8/ m i 5/ m i 0 P-7 P-3 0.0 -T cell +T cell 0 -T cell +T cell cell.2018.03.017 (2018).
K 1 v K v C
C +T cells 10. Roe, J. S. et al. Enhancer Reprogramming Promotes Pancreatic Cancer