
Page 33 - F. Cell biology
P. 33
Effects of PCB126 on PKC Activation
and Kv1.5 and Kv1.3 Channel Current
Jonghui Kim ,Soobeen Hwang , Su-Hyun Jo 1,2
1,2
1,2
1 Interdisciplinary Graduate Program for BIT Medical Convergence, Kangwon National University, Chuncheon 200-701, Korea Department of
2
Physiology, School of Medicine, Kangwon National University, Chuncheon 200-701, Korea
ABSTRACT A PKCα/βll B PKCγ C PKCε D PKCζ
β-actin
β-actin
β-actin
β-actin
PCB126 0 0.1 1 10 100 PCB126 0 0.1 1 10 100 PCB126 0 0.1 1 10 100 PCB126 0 0.1 1 10 100
PCBs have been known as serious persistent 1.8 (µM) 1.5 (µM) (µM) PCB126 (µM)
organic pollutants, causing developmental 1.5 PCB126 1.2 PCB126 1.8 1.8 PCB126
delays and motor dysfunction. we investigated 1.2 * * * 1.5 1.5
the effects of PCB126. We observed the 0.9 * * * (fold increase) 0.9 * Phosphorylation of PKCε (fold increase) 1.2 Phosphorylation of PKCζ (fold increase) 1.2
phosphorylation of PKC with signal Phosphorylation of PKCα/βll (fold increase) Phosphorylation of PKCγ 0.6 0.9 0.9
transduction, cell growth, and gene expression 0.6 0.3 0.6 0.6
by western blotting. We treated ventricular 0.3 0.3 0.3
myocytes from guinea pig with 0.1 ~ 100 μM 0.0 0 0.1 1 10 100 0.0 0 0.1 1 10 100 0.0 0 0.1 1 10 100 0.0 0 0.1 1 10 100
of PCB126 for 15 ~ 60 min. The Concentration (μM) Concentration (μM) Concentration (μM) Concentration (μM)
phosphorylation of αβⅡdecreased FIG2. Concentration-dependent effects of PCB126 on phosphorylation status of PKC isoforms. Detection of (A) p-PKCα/βII,
significantly by 20% at 1 μM of PCB126. (B) p-PKCγ , (C) p-PKCε , (D) and p-PKCζ by Western blot in the absence and the presence of PCB77 PCB126 at 0.1, 1, 10, and 100 μM for 30 min.
Also, PCB 126 increased the phosphorylation Symbols with error bars represent mean ± S.E.M. (n = 3 – 8). *P < 0.05.
of the PKCγ by 180% at 1 ~ 100 μM. A PKCα/βll B PKCγ C PKCε D PKCζ
β-actin
β-actin
However, PCB126 did not change the PCB126 0 15 30 60 β-actin 0 15 30 60 β-actin 0 15 30 60 PCB126 0 15 30 60
PCB126
PCB126
phosphorylation of PKCε and PKCζ at all 1.5 (min) 1.8 (min) 2.0 (min) (min)
concentrations of we tested. Also, we 1.2 PCB126 1.5 PCB126 * PCB126 2.0 PCB126
conducted further studies on the changes of * 1.6 1.6
Kv1.5 and Kv1.3 channel current by PCB126. 0.9 * * Phosphorylation of PKCγ (fold increase) 1.2 * * * Phosphorylation of PKCε (fold increase) 1.2 Phosphorylation of PKCζ (fold increase) 1.2
We expressed the Kv1.5 channels, which Phosphorylation of PKCα/βll (fold increase) 0.6 0.9 0.8 0.8
contributes to action potential repolarization 0.3 0.6 0.4 0.4
of myocytes in heart, and Kv1.3 channels, 0.3 0.0 0.0
which contributes to expresse immune cell 0.0 0 15 30 45 60 0 15 30 45 60 0 15 30 45 60 0 15 30 45 60
like to T lymphocytes, in Xenopus oocytes and Time of PCB treatment (min) Time of PCB treatment (min) Time of PCB treatment (min) Time of PCB treatment (min)
treated PCB126 (10μM~100 μM) for 8 FIG 3. Time-dependent effects of PCB126 on phosphorylation status of PKC isoforms. Detection of (A) p-PKCα/βII, (B) p-PKCγ,
minutes and 15 minutes. We observed that the (C) p-PKCε, (D) and p-PKCζ by Western blot in the absence and the presence of PCB126 at 0.1, 1, 10, and 100 μM for 30 min. Symbols with error bars
represent mean ± S.E.M. (n = 3 – 8). *P < 0.05.
peak and steady state current of Kv1.5 and
Kv1.3 channel did not change. The present (A) +50 (A) +50
data indicate that PCB126 could affect cardiac
function possibly by activation of PKC. There (B) -50 -60 mV (B) -50 -60 mV
results suggested that change of PKC μA
phosphorylation did not modulate the Kv 4 μA Control 10 µM PCB126 for 8 min 10 µM PCB126 for 15 min 500 ms 4
channel function. Control 10 nM PCB126 for 8 min 10 nM PCB126 for 15 min 500 ms (C) control (D) control
30nM PCB126
(D)
30nM PCB126
(C)
control
1.2 control 1.2 3nM PCB126 1.2 100nM PCB126 1.2 100nM PCB126
3nM PCB126
10nM PCB126 1.0 10nM PCB126 1.0 300nMPCB126 1.0 300nMPCB126
1.0
Keywords: Polychlorinated biphenyls, PCBs, 0.8 30nM PCB126 0.8 30nM PCB126 0.8 1uMPCB126 0.8 1uMPCB126
100nM PCB126
100nM PCB126
2uM PCB126
2uM PCB126
PKC, kv1.3 channel, Kv1.5 channel. Normalized peak current 0.6 1uM PCB126 Normalized peak current 0.6 1uM PCB126 Normalized peak current 0.6 5uM PCB126 Normalized peak current 0.6 5uM PCB126
10uM PCB126
10uM PCB126
10uM PCB126
10uM PCB126
0.4
0.4
0.4
0.4
A 0.2 0.2 0.2 -40 -20 0 20 40 60 0.2 -40 -20 0 20 40 60
0.0
0.0
0.0
0.0
-60
-60
-20
20
0
20
0
-20
Membrane Potential (mV)
Membrane Potential (mV)
(E) -60 -40 Membrane Potential (mV) 40 60 (F) -60 -40 Membrane Potential (mV) 40 60 (E) control (F) control
1.4 1.4 1.2 30nM PCB126 1.2 30nM PCB126
1.2 1.2 1.0 100nM PCB126 1.0 100nM PCB126
300nMPcB126
1.0 1.0 300nMPCB126 1uMPCb126
1uMPCB126
0.8 y-state current 0.8 0.8 2uM PCB126 0.8 2uM PCB126
5uM PCB126
0.6 control 0.6 control 0.6 5uM PCB126 0.6 10uM PCB126
Normalized steady-state current 3nM PCB126 3nM PCB126 10uM PCB126
0.4 10nM PCB126 0.4 10nM PCB126 Normalized steady-state current 0.4 Normalized steady-state current 0.4
0.2 30nM PCB126 0.2 30nM PCB126 0.2 0.2
100nM PCB126
0.0 1uM PCB126 Normalized stead 0.0 100nM PCB126
1uMPCB126
-0.2 10uM PCB126 -0.2 10uMPCB126 0.0 0.0
20
-20
0
-20
0
20
-60 -40 -20 0 20 40 60 -60 -40 -20 0 20 40 60 -60 -40 Membrane Potential (mV) 40 60 -60 -40 Membrane Potential (mV) 40 60
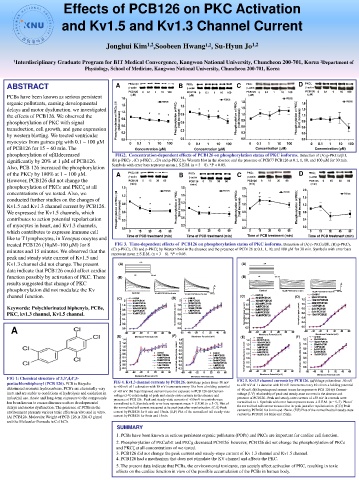
FIG 1: Chemical structure of 3,3′,4,4′,5- Membrane Potential (mV) Membrane Potential (mV) FIG 5. Kv1.5 channel currents by PCB126. (a)Voltage pulses from -50 mV
pentachlorobiphenyl (PCB 126). PCB is Bicyclic FIG 4. Kv1.3 channel currents by PCB126. (a)Voltage pulses from -50 mV to +50 mV of 1 s duration with 10 mV increments every 10 s from a holding potential
chlorinated aromatic hydrocarbons. PCB's are chemically very to +50 mV of 1 s duration with 10 mV increments every 10 s from a holding potential of -60 mV. (b) Superimposed current traces for exposure to PCB 126 (c) Current-
inert and are stable to conditions of hydrolysis and oxidation in of -60 mV. (b) Superimposed current traces for exposure to PCB 126 (c) Current- voltage (I-V) relationship of peak and steady-state currents in the absence and
voltage (I-V) relationship of peak and steady-state currents in the absence and
industrial use. Acute and long-term exposure to the compounds presence of PCB126.. Peak and steady-state currents of +50 mV in controls were presence of PCB126.. Peak and steady-state currents of +50 mV in controls were
has been known to causes diseases such as developmental normalized to 1. Symbols with error bars represent mean ± S.E.M. (n = 5~7). Plot of normalized to 1. Symbols with error bars represent mean ± S.E.M. (n = 5~7). Plot of
delays and motor dysfunction. The presence of PCBs in the the normalized tail current measured at its peak just after repolarization. (C,D) Peak the normalized tail current measured at its peak just after repolarization. (C,D) Peak
environment presents various toxic effects in vivo and in vitro. current by PCB126 for 8 min and 15min. (E,F) Plot of the normalized tail steady-state current by PCB126 for 8 min and 15min. (E,F) Plot of the normalized tail steady-state
current by PCB126 for 8min and 15min.
(A) PCB126. Molecular Weight of PCB 126 is 326.43 g/mol current by PCB126 for 8min and 15min.
and the Molecular Formula is C12H5Cl5.
SUMMARY
1. PCBs have been known as serious persistent organic pollutants (POPs) and PKCs are important for cardiac cell function.
2. Phosphorylation of PKCa/bII and PKCg decreased PCB126 however, PCB126 did not change the phosphorylation of PKCε
and PKCζ at all concentrations of we tested.
3. PCB126 did not change the peak current and steady-staye current of Kv 1.3 channel and Kv1.5 channel.
4. PCB126 had a mechanism that does not stimulate the KV channel and affects the PKC.
5. The present data indicate that PCBs, the environmental toxicants, can acutely affect activation of PKC, resulting in toxic
effects on the cardiac function in view of the possible accumulation of the PCBs in human body.