
Page 13 - F. Cell biology
P. 13
RIP1 silencing sensitizes arsenite-induced necroptotic cell death
in L929 cells
Su Bin Sin¹ and Young Sik Cho¹*
College of Pharmacy, Keimyung University, 1000 Sindang-dong, Dalseo-gu, Daegu 704-701, Republic of Korea
BACKGROUND AIM
Arsenic compounds are one of the most environmentally hazardous substances so that those Arsenic compounds such as sodium arsenite (SA) and arsenic trioxide (ATO)
are classified as human carcinogens. Despite their known increased risk of cancer, arsenite have been known to be cytotoxic. Primarily, in this study, we aimed to outline
acts as a double-edged sword, that is, arsenic is associated with various cancers while arsenic
trioxide (ATO) has been widely used in the treatment of relapsed acute promyelocytic leukemia the cell death modes caused by arsenic compounds and to address what
(APL). As can be inferred from harnessing of arsenite as an anticancer drug, arsenite has been proteins would be responsible for arsenite-induced cytotoxicity. Both SA and
reported to cause cell death in a caspase-dependent. With caspase activation, generation of ATO substantially exhibited cytotoxic activity in L929 cells. However,
oxidative stress has been suggested to be essential for arsenite-mediated cytotoxicity. On the necrostatin-1 (Nec-1) treatment significantly reversed cell death mediated by
contrary, it is involved in triggering a caspase-independent necrotic cell death via the arsenic compounds, suggesting that cells are committed to die in a programmed
mitochondrial pathway. necrotic way. Using interfering RNAs, furthermore, we found that RIP1
knockdown rendered more sensitive to SA than mock group, and that RIP3
Necrosis and apoptosis are exclusively distinctive in the aspects of morphology and its knockdown had an antagonizing effect on SA cytotoxicity. SA cytotoxicity was
underlying molecular events. Meanwhile, a specialized necrosis coined “programmed necrosis closely correlated with intracellular ROS production. Therefore, it is proposed
or necroptosis” has been generally regarded as an alternative cell death type that can be that RIP1 downregulation promotes necroptotic cell death of arsenic compounds
activated under the specific condition when tumor necrosis factor alpha (TNFα)-mediated
apoptotic machinery is defective. Besides TNFα, it has been possibly suggested that a few in L929.
chemicals and heavy metals can induce necroptosis-like cell death, distinct from apoptosis.
Similar to TNFα-mediated necroptosis, chemicals- or heavy metal-induced cell death is
rescued by necrostatin-1 (Nec-1), a specific inhibitor receptor interacting protein 1 (RIP1).
Once TNFα receptor (TNFR) ligated, RIP1 functions as a scaffolding protein of TNFα signaling,
and transmits death signals to downstream effectors by forming complex with RIP3. Therefore,
RIP1 and RIP3 are proposed to be crucial proteins that can determine cell death in favor of
necroptosis when cells are subjected to stresses. Here, we sought to delineate the underlying
mechanisms by which arsenite could induce cell death via non-apoptotic pathway. We found
that ROS were responsible for SA cytotoxicity as inferred from the consequence that ROS
scavengers could protect cells from SA exposure. Consequently, depletion of glutathione (GSH)
rendered cells more sensitive to SA than control group. Taken together, it is suggested that
SA-induced necroptotic cell death is mediated via ROS generation in L929 cells.
RESULTS
1.2 (A) BSO + SA (B) BSO + TNF-α
control SA 6 h
1
0.8
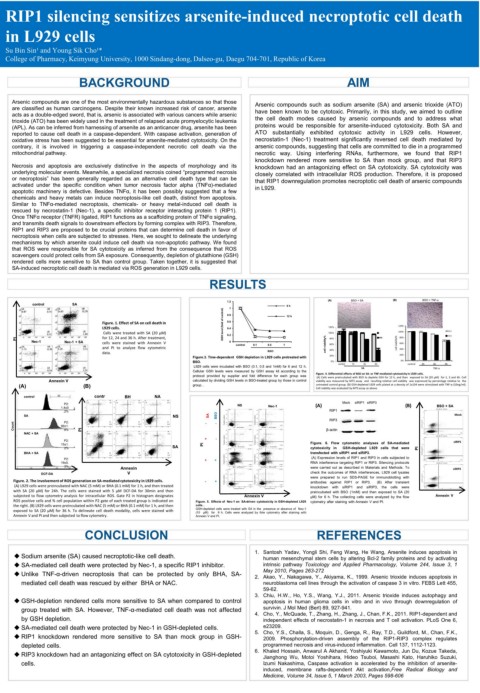
Figure. 1. Effect of SA on cell death in GSH level (fold of control) 0.6 12 h
L929 cells. 0.4 120% 120%
Cells were treated with SA (20 μM) 100% - 100% BSO(-)
PI Nec-1 Nec-1 + SA for 12, 24 and 36 h. After treatment, 0.2 0 80% BSO 80% BSO(+)
cells were stained with Annexin V
and PI to analyze flow cytometric control 0.1 0.5 1 cell viability% 60% cell viability% 60% 40%
data. BSO 40%
Figure.3. Time-dependent GSH depletion in L929 cells pretreated with 20% 20%
BSO. 0% 0%
L929 cells were incubated with BSO (0.1, 0.5 and 1mM) for 6 and 12 h. control 1h SA 3h 6h control 3h 6h TNF-α 9h
Cellular GSH levels were measured by GSH assay kit according to the
protocol provided by supplier and fold difference for each group was Figure. 4. Differential effects of BSO on SA- or TNF-mediated cytotoxicity in L929 cells.
(A) Cells were preincubated with BSO to deplete GSH for 12 h, and then exposed to SA (20 μM) for 1, 3 and 6h. Cell
Annexin V calculated by dividing GSH levels in BSO-treated group by those in control viability was measured by MTS assay and resulting relative cell viability was expressed by percentage relative to the
(A) (B) group. . untreated control group. (B) GSH-depleted L929 cells plated at a density of 1x10⁴ were stimulated with TNF-α (10ng/ml).
Cell viability was evaluated by MTS assay as above.
control contr BH NA
UL ol UR UL A UR UL C UR
P2: 10 5 2.67 1.01 10 5 2.01 1.22 10 5 1.70 0.75 (A) Mock siRIP1 siRIP3 (B)
BSO + SA
1.4±0 10 4 10 4 10 4 0.87 NS 0.24 0.55 Nec-1 0.78 Mock) BSO+SA - All Events
.2% 10 5 10 5 RIP1 10 5 21.38 0.75
SA 10 3 10 3 10 3 NS SA BSO 10 4 10 4 10 4 Mock
10 2 0 LL LR 10 2 LL LR 10 2 LL LR Propidium Iodide-A 10 10 3 2 Propidium Iodide-A 10 10 3 2 RIP3 10 3
P2:
Count 95±1. 95.86 0 10 2 10 3 10 4 0.46 10 5 0 96.57 0 10 2 10 3 10 4 0.20 10 5 0 97.15 0 10 2 10 3 10 4 0.40 10 5 - - 0 5 98.52 1.09 0 SA - All Events 10 4 0.37 0.87 10 5 0 5 97.12 3.04 0 SA Nec-1 - All Events 10 4 1.55 1.52 10 5 β-actin Propidium Iodide-A 10 2
10 2
10 2
10 3
8%
10 3
AnnexinV FITC-A
AnnexinV FITC-A
NAC + SA PI 10 5 UL 10.98 UR 28.70 10 5 UL 2.13 UR 1.63 10 5 UL 1.38 UR 2.43 10 10 4 10 10 4 -10 0 2 77.21 0 10 2 siRIP1)BSO+SA - All Events 10 4 10 5 0.66
10 3
AnnexinV FITC-A
10 4 10 4 10 4 + - 10 3 10 3 111, 7632 10 5 38.69 3.03
P2: Propidium Iodide-A 10 2 Propidium Iodide-A 10 2 siRIP1
15±1. 10 3 10 3 10 3 SA PI 0 96.72 1.32 0 93.70 BSO SA Nec-1 - All Events 1.74 Figure. 6. Flow cytometric analyses of SA-mediated 10 4
2% 10 5 36.90 0 BSO SA - All Events 10 4 29.25 10 5 10 5 25.13 0 10 2 10 3 10 4 26.81 10 5 cytotoxicity in GSH-depleted L929 cells that were PI 10 3
10 2
10 3
BHA + SA 10 2 LL LR 10 2 0 LL LR 10 2 0 LL LR 10 4 10 4 transfected with siRIP1 and siRIP3. Propidium Iodide-A
0 55.98 4.34 10 2 95.84 0.40 95.22 0.97 10 2
P2: 0 10 2 10 3 10 4 10 5 0 10 2 10 3 10 4 10 5 0 10 2 10 3 10 4 10 5 + + Propidium Iodide-A 10 3 Propidium Iodide-A 10 3 (A) Expression levels of RIP1 and RIP3 in cells subjected to -10 0 2 50.23 8.05
19±5. 10 2 0 27.57 6.28 10 0 2 42.78 5.28 RNA interference targeting RIP1 or RIP3. Silencing protocols 13.06 0 10 2 siRIP3)BSO+SA - All Events 10 4 10 5 0.50
10 3
AnnexinV FITC-A
3% 0 BSO - All Events 10 4 10 5 0 BSO Nec1 - All Events 10 4 10 5 10 5
Annexin 10 5 0.65 AnnexinV FITC-A 0.48 10 5 1.57 AnnexinV FITC-A 0.90 were carried out as described in Materials and Methods. To siRIP3
10 3
10 2
10 3
10 2
DCF-DA V 10 4 10 4 check the outcomes of RNA interferences, L929 cell lysates 10 4 10 3
Figure. 2. The involvement of ROS generation on SA-mediated cytotoxicity in L929 cells. - + Propidium Iodide-A 10 10 3 2 Propidium Iodide-A 10 10 3 2 were prepared to run SDS-PAGE for immunoblotting with Propidium Iodide-A 10 2
antibodies against RIP1 or RIP3.
(B) After transient
(A) L929 cells were preincubated with NAC (5 mM) or BHA (0.1 mM) for 1 h, and then treated 0 97.88 0 10 2 10 3 10 4 0.99 10 5 -10 0 2 95.66 0 10 2 10 3 10 4 1.87 10 5 knockdown with siRIP1 and siRIP3, the cells were 0 86.28 0.16
with SA (20 μM) for 24h. The cells were stained with 5 μM DCF-DA for 30min and then AnnexinV FITC-A AnnexinV FITC-A preincubated with BSO (1mM) and then exposed to SA (20 0 10 2 AnnexinV FITC-A 10 4 10 5
10 3
subjected to flow cytometry analysis for intracellular ROS. Gate P2 in histogram designates Annexin V μM) for 6 h. The collecting cells were analyzed by the flow Annexin V
ROS positive cells and % cell population within P2 gate of each treated group is indicated on Figure. 5. Effects of Nec-1 on SA-driven cytotoxicity in GSH-depleted L929 cytometry after staining with Annexin V and PI.
the right. (B) L929 cells were preincubated with NAC (5 mM) or BHA (0.1 mM) for 1 h, and then cells .
exposed to SA (20 μM) for 36 h. To delineate cell death modality, cells were stained with GSH-depleted cells were treated with SA in the presence or absence of Nec-1
Annexin V and PI and then subjected to flow cytometry. (10 μM) for 9 h. Cells were analyzed by folw cytometry after staining with
Annexin V and PI.
CONCLUSION REFERENCES
Sodium arsenite (SA) caused necroptotic-like cell death. 1. Santosh Yadav, Yongli Shi, Feng Wang, He Wang, Arsenite induces apoptosis in
human mesenchymal stem cells by altering Bcl-2 family proteins and by activating
SA-mediated cell death were protected by Nec-1, a specific RIP1 inhibitor. intrinsic pathway Toxicology and Applied Pharmacology, Volume 244, Issue 3, 1
May 2010, Pages 263-272
Unlike TNF-α-driven necroptosis that can be protected by only BHA, SA- 2. Akao, Y., Nakagawa, Y., Akiyama, K., 1999. Arsenic trioxide induces apoptosis in
mediated cell death was rescued by either BHA or NAC. neuroblastoma cell lines through the activation of caspase 3 in vitro. FEBS Lett 455,
59-62.
3. Chiu, H.W., Ho, Y.S., Wang, Y.J., 2011. Arsenic trioxide induces autophagy and
GSH-depletion rendered cells more sensitive to SA when compared to control apoptosis in human glioma cells in vitro and in vivo through downregulation of
survivin. J Mol Med (Berl) 89, 927-941.
group treated with SA. However, TNF-α-mediated cell death was not affected 4. Cho, Y., McQuade, T., Zhang, H., Zhang, J., Chan, F.K., 2011. RIP1-dependent and
by GSH depletion. independent effects of necrostatin-1 in necrosis and T cell activation. PLoS One 6,
e23209.
SA-mediated cell death were protected by Nec-1 in GSH-depleted cells. 5. Cho, Y.S., Challa, S., Moquin, D., Genga, R., Ray, T.D., Guildford, M., Chan, F.K.,
RIP1 knockdown rendered more sensitive to SA than mock group in GSH- 2009. Phosphorylation-driven assembly of the RIP1-RIP3 complex regulates
depleted cells. programmed necrosis and virus-induced inflammation. Cell 137, 1112-1123.
RIP3 knockdown had an antagonizing effect on SA cytotoxicity in GSH-depleted 6. Khaled Hossain, Anwarul A Akhand, Yoshiyuki Kawamoto, Jun Du, Kozue Takeda,
Jianghong Wu, Motoi Yoshihara, Hideo Tsuboi, Masashi Kato, Haruhiko Suzuki,
cells. Izumi Nakashima, Caspase activation is accelerated by the inhibition of arsenite-
induced, membrane rafts-dependent Akt activation,Free Radical Biology and
Medicine, Volume 34, Issue 5, 1 March 2003, Pages 598-606