Page 45 - D. Cancer biology
P. 45

D-32


            BACKGROUNDS                                                                                                                                                                                                      Metagenomics analysis                                                                                                             A                                                                           B


                                                                                                                                                                                            Comparison of alpha diversity in the CRC patients and


                  Colorectal cancer (CRC) is the most common type                                                                                                                           healthy controls revealed no significant differences


                  cancers in the world                                                                                                                                                      based on the Chao1 and Shannon indexes, as shown in


                  CRC occurs sporadically in the majority of cases,                                                                                                                         Figure 2A


                  indicating the predominant cause of the disease are                                                                                                                       Beta diversity at the phylum and genus levels was


                  environmental factors                                                                                                                                                     represented through PCoA (Figure 2B-C). A comparison


                  Diet-induced changes in gut-microbiome are recently                                                                                                                       of beta diversity at the genus level demonstrated a clear                                                                                                       Figure 4. Distinct metabolic profiling between CRC patients and


                  supposed to contribute on epidemics of CRC                                                                                                                                separation between the groups compared to the                                                                                                                   healthy controls. A Score plot of the three-dimensional PCA and B

                                                                                                                                                                                            phylum-level clusters                                                                                                                                           Loading plots of PC1 and PC2 from the PCA results of differentially


                                                                                                                                                                                            Three individual phyla were found; Firmicutes was                                                                                                               accumulating metabolites from CRC patients versus healthy controls


            AIM                                                                                                                                                                             significantly increased in CRC patients, whereas the                                                                                                            Table 1. List of metabolites significantly changed in CRC


                                                                                                                                                                                            level of Proteobacteria and Tenericutes was decreased


                                                                                                                                                                                            (Figure 3A,C-D)                                                                                                                                                                          Metabolite                               Class                   Fold-change                 p-value
                  This study was aimed to investigate the association of                                                                                                                    For the genus level, 34 bacterial genera between the                                                                                                                                        Leucine                                                        (CRC/Healthy control)     5.75E-03
                                                                                                                                                                                                                                                                                                                                                                                                                                                                                   (FDR-adjusted)
                                                                                                                                                                                                                                                                                                                                                                                                                                                                2.43
                  metagenomics and metabolomics in gut extracellular                                                                                                                        groups were significantly changed (Figure 3B, E-F)                                                                                                                                        Isoleucine                                                                2.19             5.23E-03


                  vesicles (EVs) of CRC and healthy subjects                                                                                                                                                                                                                                                                                                                            Alanine                           Amino acid                            1.67             4.31E-02

                                                                                                                                                                                        A                                                B                                              C                                                                                                Lysine                                                                 1.44             1.48E-02
                                                                                                                                                                                                                                                                                                                                                                                      Tyramine                                                                  1.42             1.57E-22

                                                                                                                                                                                                                                                                                                                                                                             Aminoisobutyric acid                                                              -1.12             6.66E-03
            METHODS                                                                                                                                                                                                                                                                                                                                                                Ethanolamine                      Aromatic alcohol                           1.38             4.56E-04
                                                                                                                                                                                                                                                                                                                                                                                                                       Amino alcohol

                                                                                                                                                                                                                                                                                                                                                                                                                                                                1.59
                                                                                                                                                                                                                                                                                                                                                                                                                                                                                 1.99E-12
                                                                                                                                                                                                                                                                                                                                                                                        Phenol
                                                                                                                                                                                                                                                                                                                                                                                     Furoic acid                                                                1.42             1.31E-29

                                                                                                                                                                                                                                                                                                                                                                                   Succinic acid                      Carboxylic acid                           3.15             4.46E-09

                                                                Study Population                                                                                                                                                                                                                                                                                                     Oxalic acid                                                                1.40             1.66E-03

                                                                                                                                                                                                                                                                                                                                                                                   Butanoic acid                                                               -1.30             2.26E-04

                                                                                                                                                                                                                                                                                                                                                                                  Hexanoic acid                                                                 1.30             9.38E-06
                  A total of 32 patients with colorectal cancer and 40                                                                                                                                                                                                                                                                                                             Palmitic acid                           Fatty acid                           1.44             4.37E-25


                  healthy control individuals from Seoul National                                                                                                                                                                                                                                                                                                                     Oleic acid                                                                1.32             3.09E-04


                  University Bundang Hospital, Chung-Ang University                                                                                                                   Figure 2. Alpha and beta diversity comparisons of microbiomes


                  Hospital and Haewoondae Baek Hospital participated in                                                                                                               collected from CRC patients and healthy controls. A Chao1 and                                                                                                                                                        Diagnostic modeling


                  the present study between April 2016 and April 2018                                                                                                                 Shannon indexes indicate alpha diversity. Principal coordinate


                  Patients were diagnosed for the first time according to                                                                                                             analysis (PCoA) plots represent beta diversity at the B phylum and C                                                                                                      A Pearson rank correlation analysis demonstrated a


                  the diagnostic criteria proposed by the International                                                                                                               genus levels. Red circles represent healthy control individuals and                                                                                                       close correlation between the gut microbiota and
                                                                                                                                                                                      blue circles represent CRC patients
                  Union Against Cancer and the American Joint                                                                                                                                                                                                                                                                                                   certain metabolic products (Figure 5A)


                  Committee on Cancer in 2013                                                                                                                                           A                                                                   B                                                                                                   Ultimately, two metabolites (leucine and oxalic acid) and


                  Stool samples were collected prior to surgery or bowel                                                                                                                    100%                                                                  100%                                             g__Prevotella 9                              two bacterial genera (Collinsella and Solanum
                                                                                                                                                                                                                                                                                                                   g__Faecalibacterium
                                                                                                                                                                                                                                                                   90%
                  preparation and stored at -20 ℃                                                                                                                                            90%                                                                                                                   g__Bacteroides                               melongena) were selected. Figure 5B-C shows the ROC
                                                                                                                                                                                                                                                                                                                   g__[Eubacterium]
                                                                                                                                                                                             80%                                              p__Firmicutes        80%                                             coprostanoligenes
                                                                                                                                                                                                                                              p__Bacteroidetes                                                     g__Clostridium sensu stricto 1

                                                                                                                                                                                             70%                                              p__Proteobacteria    70%                                             g__Ruminococcus 1                            of the logistic regression model to discriminate CRC-
                                                                                                                                                                                                                                              p__Actinobacteria                                                    g__Escherichia-Shigella
                                       Collection of Extracellular Vesicles                                                                                                                  60%                                              p__Tenericutes       60%                                             g__Turicibacter                              positive patients from healthy controls

                                                                                                                                                                                                                                              p__Verrucomicrobia
                                                                                                                                                                                             50%                                              p__Fusobacteria      50%                                             g__Lactobacillus
                                                                                                                                                                                                                                                                                                                   g__Peptoclostridium
                 Prior to separation of bacterial EVs from stool, a stool                                                                                                                    40%                                              p__Cyanobacteria     40%                                             g__Terrisporobacter                          A
                                                                                                                                                                                                                                              p__Saccharibacteria
                 sample (1 g) was mixed with 10 mL of phosphate-                                                                                                                             30%                                              p__Euryarchaeota     30%                                             g__Pseudomonas
                                                                                                                                                                                                                                              p__Acidobacteria
                                                                                                                                                                                                                                                                                                                   g__Enterococcus
                 buffered saline (PBS) followed by vibration for 24 h                                                                                                                        20%                                              Others               20%                                             g__Subdoligranulum
                                                                                                                                                                                                                                              Unassigned
                                                                                                                                                                                                                                                                                                                   g__Methylobacterium
                 The samples were then incubated to separate the EVs                                                                                                                         10%                                                                   10%                                             g__Ruminococcus 2


                 from human stool; EVs from the stool samples were                                                                                                                            0%       Healthy control         CRC                                  0%      Healthy control         CRC            g__Streptococcus


                 then isolated using centrifugation at 10,000 × g for 10                                                                                                               C                                                                     D


                 min at 4 °C


                 Bacteria and foreign particles contained in the


                 supernatant were thoroughly eliminated by filtration


                 using a 0.22-μm pore size


                             Metagenomics and Metabolomics profiling


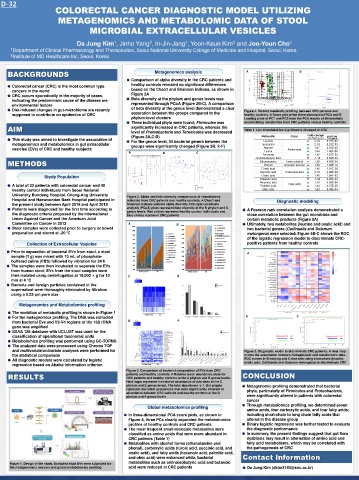
                   The workflow of metabolic profiling is shown in Figure 1


                   For the metagnomics profiling, The DNA was extracted                                                                                                                                       Healthy control      CRC                                                                                                                        B                                                                        C


                   from bacterial Evs and V3-V4 regions of the 16S rDNA                                                                                                                 E                                                                     F


                   gene was amplified


                   SILVA 128 database with UCLUST was used for the


                   classification of operational taxonomic units                                                                                                                                                                                                                                                                                                                                          Metagenomics AUC   1.00                                                Metagenomics AUC   0.95


                   Metabolomics profiling was performed using GC-TOFMS                                                                                                                                                                                                                                                                                                                                      Metabolite AUC   0.94                                                  Metabolite AUC   0.92
                                                                                                                                                                                                                                                                                                                                                                                                            Combined AUC
                                                                                                                                                                                                                                                                                                                                                                                                                             1.00
                                                                                                                                                                                                                                                                                                                                                                                                                                                                                                    1.00
                                                                                                                                                                                                                                                                                                                                                                                                                                                                                   Combined AUC
                   The analyzed data were processed using Chroma TOF

                   and multivariate/univariate analyses were performed for                                                                                                                                                                                                                                                                                  Figure 5. Diagnostic model to discriminate CRC patients. A Heat map


                   the statistical comparison                                                                                                                                                                                                                                                                                                               shows the association between metagenomic and metabolomic data.


                   All diagnostic models were calculated by logistic                                                                                                                                                                                                                                                                                        ROC curves in B training and C test sets using biomarkers (leucine,


                   regression based on Akaike information criterion                                                                                                                                         Healthy control     CRC                                                                                                                         oxalic acid, Collinsella and Solanum melongena) to discriminate CRC


                                                                                                                                                                                     Figure 3. Comparison of bacterial composition of EVs from CRC

             RESULTS                                                                                                                                                                 patients and healthy controls. A Relative taxon abundance plots for                                                                                                  CONCLUSION


                                                                                                                                                                                     CRC patients and healthy controls at the A phylum and B genus levels.

                                                                                                                                                                                     Heat maps represent the relative abundance of microbes at the C

                                                                                                                                                                                     phylum and E genus levels. The total abundance is 1. Bar graphs                                                                                                            Metagenomic profiling demonstrated that bacterial


                                                                                                                                                                                     represent microbial populations that were significantly different in                                                                                                       phyla, particularly of Firmicutes and Proteobacteria,

                                                                                                                                                                                     abundance between CRC patients and healthy controls at the D

                                                                                                                                                                                     phylum and F genus levels                                                                                                                                                  were significantly altered in patients with colorectal

                                                                                                                                                                                                                                                                                                                                                                cancer


                                                                                                                                                                                                                   Global metabolomics profiling                                                                                                                Through metabolomics profiling, we determined seven
                                                                                                                                                                                                                                                                                                                                                                amino acids, four carboxylic acids, and four fatty acids;


                                                                                                                                                                                        In three-dimensional PCA score plots, as shown in                                                                                                                       including short-chain to long chain fatty acids that


                                                                                                                                                                                        Figure 4, three PCs clearly separated the metabolomics                                                                                                                  altered in the disease group


                                                                                                                                                                                        profiles of healthy controls and CRC patients                                                                                                                           Binary logistic regression was further tested to evaluate


                                                                                                                                                                                        The most frequent small-molecule metabolites were                                                                                                                       the diagnostic performance


                                                                                                                                                                                        classified as amino acids that were more abundant in                                                                                                                    In summary, the present findings suggest that gut flora


                                                                                                                                                                                        CRC patients (Table 1)                                                                                                                                                  dysbiosis may result in alternation of amino acid and


                                                                                                                                                                                        Metabolites with alcohol forms (ethanolamine and                                                                                                                        fatty acid metabolisms, which may be correlated with


                                                                                                                                                                                        phenol), carboxylic acids (furoic acid, succinic acid, and                                                                                                              the pathogenesis of CRC


                                                                                                                                                                                        oxalic acid), and fatty acids (hexanoic acid, palmitic acid,


                                                                                                                                                                                        and oleic acid) were enhanced while, bacterial                                                                                                                    Contact Information


               Figure 1. Design of the study. Extracted stool EVs were subjected for                                                                                                    metabolites such as aminoisobutyric acid and butanoic

               the metagenomics analysis and global metabolomics profiling                                                                                                              acid were reduced in CRC patients                                                                                                                                       Da Jung Kim (dkim3193@snu.ac.kr)
   40   41   42   43   44   45   46   47   48   49   50