
Page 25 - D. Cancer biology
P. 25
Broad anti-cancer effect of a specific thioredoxin
reductase 1 inhibitor
Eunkyu Sung, Jiyoung Lee and Sang Won Kang
Department of Life Sciences, Ewha Womans University, Seoul, 120-750, Korea.
Introduction
Reactive oxygen species (ROS) include the superoxide anion, hydrogen peroxide, and hydroxyl radicals. All living things produce ROS, primarily through leakage of electrons
in mitochondrial respiration. The thioredoxin (Trx) and Trx reductase (TrxR) systems are key antioxidant systems for maintaining reactive oxygen species (ROS) balance.
High ROS levels are produced because of abnormal proliferation and survival signaling. The expression of Trx/TrxR enzymes increases to eliminate ROS. To date, several
small-molecule inhibitors that target the Trx/TrxR system have been used to treat cancer cells. In this system, mammalian TrxR exists as cytosolic TrxR1 and mitochondria
TrxR2, but most of the compounds known so far cannot distinguish TrxR1 and TrxR2. However, targeting TrxR2 affects the mitochondria function, which, as a result, comes
to affect normal cells too. In this study, we characterize a new compound (225-C8) that specifically inhibits cytosolic TrxR1, and examine how it affects cancer cells and
normal cells.
Study aims
To examine whether 225-C8 detected via screening is an Figure 2. Cytotoxicity of 225-C8 and auranofin treated A Huh7 B
inhibitor of TrxR. cancer cell lines 120 siControl ٞ 120 siControl
24h siTrxR1
To examine whether 225-C8 distinguishes between (A) TXNRD1 (TrxR1) and TXNRD2 (TrxR2) expression correlated with 100 siTrxR1 100 72h
cytosolic TrxR1 and mitochondrial TrxR2. patient survival. Kaplan–Meier RNA-seq curves showing survival in the 80 80 *
cases of high and low expression of TXNRD1 and TXNRD2 in liver and
To find the mechanism by which it affects mammalian lung cancer patients. (B-D) Cytotoxicity of 225-C8 in (B) liver cancer TrxR1 mRNA level (% of control) 60 Cellular TrxR activity (% of control) 60
cancer cells and normal cells. cell lines HepG2, Huh7, and Hep3B; (C) colon cancer cell lines RKO 40 40
and HCT116; and (D) lung cancer cell lines A549 and H460. (E-G) 20 20 *
225-C8 Cytotoxicity of auranofin in (E) liver cancer cell lines HepG2, Huh7, and 0 0 Huh7
? Hep3B; (F) colon cancer cell lines RKO and HCT116; and (G) lung Huh7
cancer cell lines A549 and H460. C siControl siTrxR1 D Huh7
0.6
Huh7 siControl
siTrxR1
C 0.5
A x10 6 MS: 0.0060-0.2593/ Sample3 / ESI+/ 230080 10 5 2000ESI+0.1%FA ACN / (908685) 0.4 *
225-C8 1.00 447.1477 120 * A 450
0.90
0.80 siControl 0.3
2500.000 0.70 siTrxR1
8.852 100
2000.000 Inensity 0.60 0.2
0.50
Methods Voltage (mV) 1500.000 0.40 213.0516 Colony number (% of control) 80 60 0.1 1 2 3 4 5
0.30
0.20
0.00
Recombinant and cellular thioredoxin reductase activity 1000.000 0.10 50 100 150 200 250 300 350 400 450 500 550 600 650 700 750 800 850 900 893.3279 950 1000 40 Day
500.000
assay using DTNB 0.000 D x10 4 MS: 0.8328-1.1262/ Sample1 / ESI+/ 230080 10 5 2000ESI+0.1%FA ACN / m/z (11754) 20
Cell viability assay 0.000 1.053 2.107 3.160 4.213 5.267 6.320 7.373 8.427 9.480 10.533 11.587 12.640 13.693 14.747 15.800 16.853 17.907 18.960 1.20 447.1465 0 Huh7
1.10
Time (min) 1.00
Cell colony formation and proliferation assay 0.90 492.9507
0.80
0.70
High-performance liquid chromatography B Huh7 Inensity 0.60 376.2007 Figure 5. Decreased colony formation and proliferation in
0.50
2500.000 0.40 454.2288 663.3799 TrxR1-knockdown cell
0.30
0.20 221.0415 284.2783 628.3062 726.3837
Results 2000.000 0.10 50 100 150 200 250 300 350 400 450 500 550 600 650 700 750 800 810.4850 850 875.4270 900 950 1000 992.3649 (A) Huh7 cells were transfected with siTrxR1 for 24 h. mRNA levels were
0.00
1500.000
observed by real-time PCR. (B) Cellular TrxR activity in TrxR1 knockdown
A B Voltage (mV) 1000.000 7.238 E x10 4 MS: 1.1916-1.3183/ Sample2 / ESI+/ 230080 10 5 2000ESI+0.1%FA ACN / m/z (17841) cells. Huh7 was transfected for 24 h and 72 h, and cellular TrxR activity
O R 1 1.4 Control 500.000 1.75 was determined using a modified insulin endpoint assay. (C) TrxR1-
225-C8 1.50 447.1701 knockdown Huh7 cells were incubated for 10 days. Cells were then fixed
N P 1.2 001-E4 0.000
Au Auranofin 1.25 with formaldehyde and stained with crystal violet. Plates were imaged,
HN O O 1.0 0.000 1.053 2.107 3.160 4.213 5.267 6.320 7.373 8.427 9.480 10.533 11.587 12.640 13.693 14.747 15.800 16.853 17.907 18.960 1.00
N NH S Inensity
N N N O O 0.75 353.2242 and colonies were counted with Image J software. (D) TrxR1-knockdown
N R 2 N O O A340 0.8 Time (min) 288.2503
S NH 0.50 726.4125 Huh7 cells were incubated for five days. Every 24 h, cell viability was
F N O O O O 0.6 0.25 316.2800 430.8691 507.2256 591.4482 663.4059 measured. Results are shown as the average of three experiments
244.2262 763.1283 838.7859 949.7568
0.4 0.00 performed in triplicate, and the significance was evaluated by a Student’s
225-C8 001-E4 Auranofin 0.2 50 100 150 200 250 300 350 400 450 m/z 500 550 600 650 700 750 800 850 900 950 1000 t-test (*P <0.01).
0 100 200 300 400 500 600
Time (s)
C D Figure 3. Analysis of 225-C8 by liquid chromatography
TrxR1 TrxR1 and mass spectrometry
140 Auranofin 120 Auranofin (A) 225-C8 analyzed by HPLC using a C18 column and detection at A 160 225-C8 B 160 Auranofin
DTNB reduction (% of control) 100 80 60 40 001-E4 DTNB reduction (% of control) 80 60 40 extracted with methanol. The extract analyzed by HPLC using a C18 120 CCD841CoN 120 CCD841CoN
120
225-C8
225-C8
240 nm. (B) Huh7 cells treated with 225-C8 for 1 h, and lysates
100
MCF10A
MCF10A
AML12
AML12
column and detection at 240 nm. (C) 225-C8 mass spectrometry
analysis. (D) The peak fractions at 8.8 min and (E) 7.2 min of HPLC
0 20 20 analyzed by mass spectrometry. Cell viability (% of control) 80 Cell viability (% of control) 80
10 -9 10 -8 10 -7 10 -6 10 -5 0 40 40
10 -10 10 -9 10 -8 10 -7 10 -6
log [compound](M) log [compound](M)
TrxR2
E F GR A Liver cancer B Colon cancer C Lung cancer Control 225-C8(uM): 0 0.05 0.1 1 5 10 20 50 100 Auranofin(uM): 0 0.05 0.1 1 5 10 20 50 100
0
0
100 80 Auranofin 120 100 Auranofin ٞ 120 100 225-C8 Control ٞ 120 100 225-C8 Control ٞ 120 100 N.S N.S 225-C8 Cell Lysate C
225-C8
Cell
Cell
DTNB reduction (% of control) 60 40 % of control 80 60 Cellular TrxR activity (% of control) 80 60 * Cellular TrxR activity (% of control) 80 60 * * Cellular TrxR activity (% of control) 80 60 2.5 Control AML12
Lysate
225-C8
Lysate
225-C8
2.0
20
20 40 40 20 * * 40 20 * * 40 20 * * A 450 1.5
0 0 0 * * * 0 0
10 -10 10 -9 10 -8 10 -7 10 -6 10 -8 10 -7 10 -6 HepG2 Huh7 Hep3B RKO HCT116 A549 H460 1.0
log [compound](M) log [compound](M) D
225-C8: DMSO 0.5uM 1uM 2uM 3uM 4uM Liver cancer 0.5
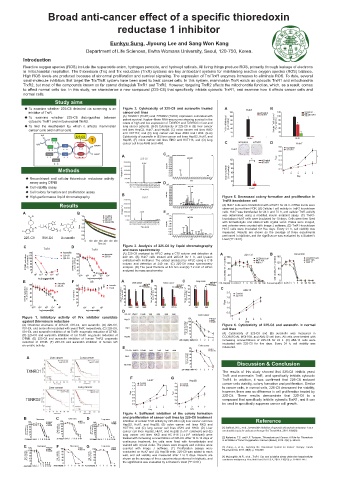
Figure 1. Inhibitory activity of Prx inhibitor candidate 120 HepG2 1 2 3 4 5
against thioredoxin reductase HepG2 100 Huh7 Day
Hep3B
(A) Chemical structures of 225-C8, 001-E4, and auranofin. (B) 225-C8, 80 Figure 6. Cytotoxicity of 225-C8 and auranofin in normal
001-E4, and auranofin incubated with yeast TrxR, respectively. (C) 225-C8, Huh7 Colony number (% of control) 60 cell lines
001-E4, and auranofin inhibition of rat TrxR1 enzymatic reduction of DTNB. 40 (A) Cytotoxicity of 225-C8 and (B) auranofin was measured in
(D) 225-C8 and auranofin inhibition of rat TrxR1 enzymatic reduction of 20 CCD841CoN, MCF10A, and AML12 cell lines. All cells were treated with
0
DTNB. (E) 225-C8 and auranofin inhibition of human TrxR2 enzymatic Hep3B 225-C8(uM) : DMSO 0.5 1 2 3 4 increasing concentrations of 225-C8 for 24 h. (C) AML12 cells were
reduction of DTNB. (F) 225-C8 and auranofin inhibition of human GR incubated with 225-C8 for five days. Every 24 h, cell viability was
enzymatic activity. Colon cancer
E 120 measured.
225-C8: DMSO 0.5uM 1uM 2uM 3uM 4uM 100 RKO
HCT116
Colony number 40
A Liver cancer Lung cancer RKO (% of control) 80 60
HCT116 20 Discussion & Conclusion
0
TXNRD1 225-C8(uM) : DMSO 0.5 1 2 3 4 The results of this study showed that 225-C8 inhibits yeast
TrxR and mammalin TrxR, and specifically inhibits cytosolic
F G
Huh7 Hep3B TrxR1. In addition, it was confirmed that 225-C8 reduced
1.6 Control 0.7 Control cancer cells viability, colony formation and proliferation. Similar
Liver cancer Lung cancer 1.4 225-C8 0.6 225-C8 to cancer cells, in normal cells, 225-C8 decreased the viability,
1.2 * 0.5
A 450 1.0 A 450 0.4 however, there was no difference in cell proliferation treated by
0.8
0.3 225-C8. These results demonstrate that 225-C8 is a
0.6
TXNRD2 0.4 0.2 compound that specifically inhibits cytosolic TrxR1, and it can
0.2 0.1 be used to specifically suppress cancer cell growth.
1 2 3 4 5 1 2 3 4 5
Day Day
Figure 4. Sufficient inhibition of the colony formation
B Liver cancer C Colon cancer D Lung cancer and proliferation of cancer cell lines by 225-C8 treatment
120 HepG2 120 RKO 140 A549 Inhibition of cellular TrxR activity by 225-C8 in (A) liver cancer cell lines Reference
HCT116
100 Huh7 100 80 120 H460 HepG2, Huh7, and Hep3B; (B) colon cancer cell lines RKO and
Hep3B
Cell viability (% of control) 80 60 40 Cell viability (% of control) 60 40 Cell viability (% of control) 80 60 40 HCT116; and (C) lung cancer cell lines A549 and H460. (D) Liver [1] Stafford, W.C., et al., Irreversible inhibition of cytosolic thioredoxin reductase 1 as a
100
mechanistic basis for anticancer therapy. Sci Transl Med, 2018. 10(428).
cancer cell lines HepG2, Huh7, and Hep3B (1˘10 ଷ cells/well) and (E)
0 20 20 0 20 0 lung cancer cell lines RKO and HCT116 (1 ˘ 10 ଷ cells/well) were [2] Karlenius, T.C. and K.F. Tonissen, Thioredoxin and Cancer: A Role for Thioredoxin
225-C8(uM): 0 0.05 0.1 1 5 10 20 50 100 225-C8(uM): 0 0.05 0.1 1 5 10 20 50 100 225-C8(uM): 0 0.05 0.1 1 5 10 20 50 100 treated with increasing concentrations of 225-C8. After 10 to 14 days of in all States of Tumor Oxygenation. Cancers (Basel), 2010. 2(2): p. 209-32.
continuous treatment, the cells were fixed with formaldehyde and
E 120 Liver cancer HepG2 F 100 Colon cancer RKO G 100 Lung cancer A549 stained with crystal violet. The plates were imaged, and colonies were [3]Zhang, J.,etal., Targeting the Thioredoxin System for Cancer Therapy. Trends
counted with Image J software. (F) Proliferation assays were
Huh7
H460
HCT116
Pharmacol Sci, 2017. 38(9): p. 794-808.
100
Cell viability (% of control) 80 60 Hep3B Cell viability (% of control) 80 60 40 Cell viability (% of control) 80 60 40 conducted on Huh7 and (G) Hep3B cells. 225-C8 was added to each [4] McLoughlin, M.R., et al., TrxR1, Gsr, and oxidative stress determine hepatocellular
well, and cell viability was measured after 1 to 5 days. Results are
shown as the average of three experiments performed in triplicate, and
20 40 20 20 the significance was evaluated by a Student’s t-test (*P <0.01). carcinoma malignancy. Proc Natl Acad Sci U S A, 2019. 116(23): p. 11408-11417.
0 0 0
Auranofin(uM): 0 0.05 0.1 1 5 10 20 50 100 Auranofin(uM): 0 1 2 5 10 50 Auranofin(uM): 0 1 2 5 10 50