
Page 23 - D. Cancer biology
P. 23
Phage display-identified PD-L1-binding peptides reinvigorate
T-cell activity and inhibit tumor progression
.
Smriti Gurung 1,2 and Byungheon Lee 1,2,3
2
1 Department of Biochemistry and Cell Biology, Tumor Heterogeneity and Network (THEN) Center, BK21 Plus KNU Biomedical Convergence Program, School of medicine,
3
Kyungpook National University , Daegu 41944, Korea
A B F G
Abstract Control pep PD-L1
Blockade of programmed cell death ligand-1 (PD-L1) restores T-cell activity and enhances anti-tumor
immunity. Screening a phage-displayed peptide library for peptides that selectively bind to PD-L1-
overexpressing cells identified two peptides, CLQKTPKQC and CVRARTR (PD-L1Pep-1 and PD-L1Pep-
2, respectively) that appeared to block PD-L1. PD-L1Pep-1 and PD-L1Pep-2 preferentially bound to high
PD-L1-expressing cells over low PD-L1-expressing cells; binding was further enhanced by interferon-γ, an
inducer of PD-L1 expression. Binding affinities of PD-L1Pep-1 and PD-L1Pep-2 were approximately 373
and 281 nM, respectively. Cellular binding of the PD-L1-binding peptides was reduced by silencing PD-L1 C D H I
gene expression or competition with anti-PD-L1 antibody. PD-L1Pep-1 and PD-L1Pep-2 induced the PD-L1Pep-1 PD-L1Pep-2
internalization and downregulated cell surface levels of PD-L1. The PD-L1-binding peptides restored
interferon-γ secretion and T-cell proliferation to cells inhibited by co-culture with tumor cells or dendritic
cells or culture on PD-L1-coated plates. Intravenously injected PD-L1Pep-1 and PD-L1Pep-2 efficiently
homed to tumor tissues, inhibited tumor growth, and increased CD8+/FoxP3+ ratio in mice. The PD-L1-
binding peptides in combination with doxorubicin and PD-L1-targeted liposomal doxorubicin increased
anti-tumor activity and CD8+/FoxP3+ ratio more than doxorubicin alone and untargeted liposomal
doxorubicin, respectively. These results suggest that PD-L1Pep-1 and PD-L1Pep-2 block PD-L1 and
reinvigorate T-cell activity, inhibiting tumor growth by enhancing anti-tumor immunity. E
Co-culture
Introduction
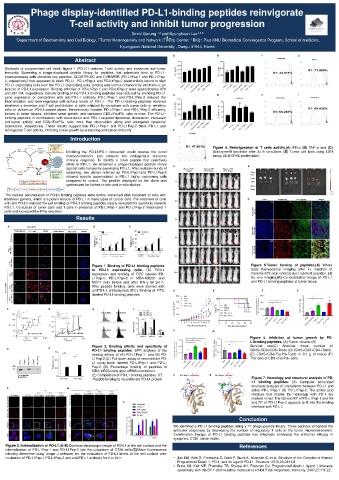
Figure 4. Reinvigoration of T cells activity.(A) IFN-γ (B) TNF-α and (C)
Inhibiting the PD-L1/PD-1 interaction could reverse the tumor Granzyme-B secretion after 24 h co-culture. (D) Tumor cell lysis using LDH
microenvironment and enhance the endogenous antitumor assay. (E-I) CFSE proliferation.
immune response. To identify a novel peptide that selectively
binds to PD-L1, we screened a phage-displayed peptide library
against cells transiently expressing PD-L1. After multiple rounds of A Flamma 675- Flamma 675- Flamma 675- B
screening, two clones referred as PD-L1Pep-1and PD-L1Pep-2 Control PD-L1Pep-1 PD-L1Pep-1 Tumor
showed specific accumulation to PD-L1 highly expressing cells Heart
compared to control. The peptide displayed on the clone was 1 h Lungs
Liver
synthesized for further in-vitro and in-vivo studies Spleen
kidney
The cellular accumulation of PD-L1 binding peptides were further enhanced after treatment of cells with
interferon gamma, which is a potent inducer of PD-L1 in many types of cancer cells. Pre-treatment of cells C DAPI Peptide (red) PD-L1 (green) Merged
with anti-PD-L1 reduced the cell binding of PD-L1 binding peptides clearly revealed the specificity towards 2 h
PD-L1. Co-culture of tumor cells and T cells in presence of PD-L1Pep-1 and PD-L1Pep-2 reactivated T 675-
cells and increased the IFN secretion. Flamma Control
Results 4 h
A MDA-MB231 MCF 7 B C
675-
Peptide (green) PD-L1 (red) Merged Peptide (green) PD-L1 (red) Merged 1 0 0 PD-L1Pep-1
M M D A - M B 2 3 1 Flamma
FITC-Control Peptide bound cells (%) 8 0 ** * * * Peptide bound cells (%) 6 h
C F 7
6 0
4 0
***
FITC- PD-L1Pep-1 2 0 0 5 0 1 0 2 5 5 0 675- Flamma PD-L1Pep-2
C o n t r o l P D - L 1 P e p - 1 ( M ) 8 h
FITC- PD-L1Pep-2 Figure 1. Binding of PD-L1 binding peptides Figure 5.Tumor homing of peptides.(A) Whole
to PD-L1 expressing cells. (A) PD-L1 body fluorescence imaging after i.v injection of
FITC- Control expression and binding of FITC labeled PD- 12 h Flamma 675 near infrared dyer labelled peptides. (J)
L1Pep-1, PD-L1Pep-2 in MDA-MB231 and Ex vivo imaging.(K) Co-localization image of PD-L1
MCF7 cells before and after IFN-γ for 24 h. and PD-L1 binding peptides at tumor tissue.
treated FITC- PD-L1 Pep-1 After peptide binding, cells were stained with
IFN -γ- antiPD-L1 antibody(red).(B-C) Binding of FITC A B E F
labeled PD-L1 binding peptides.
PD-L1 Pep-2
FITC-
Tumor volume (mm 3 )
A B E F Survival (%)
Relative binding C Days after start of treatment D Days after start of treatment
Figure 5. Inhibition of tumor growth by PD-
hPD-L1 mPD-L1 BSA
L1binding peptides. (A) Tumor volume (B)
Figure 2. Binding affinity and specificity of Survival rate(C) Absolute mean number of
C D
PD-L1 binding peptides. SPR analysis of the CD45+CD3+CD8+Tcells (D) CD45+CD3+CD4+Tcells.
binding affinity of (A) PD-L1Pep-1 and (B) PD- (E) CD45+CD4+FoxP3+Tcells in 0.1 g of tissue (F)
The ratio of CD8+/FoxP3+ cells.
rhPD-L1 Control PD-L1Pep-1 Control PD-L1Pep-2 Peptide binding (%) L1Pep-2.(C) Pull down assay of recombinant PD-
L1 using biotin labeled PD-L1Pep-1 and PD-L1
kDa Pep-2 (D) Percentage binding of peptides to
37
MDA-MB231cells after siRNA knockdown.
3 7
7
3
PD: Streptavidin (E) Competition of PD-L1 binding peptides. (F) A PD-L1Pep-1: CLQKTPKQC B PD-L1Pep-2: CVRARTR
IB: Anti-PD-L1 Figure 7. Homology and structural analysis of PD-
PD-L1Pep-1 PD-L1Pep-2 Peptide binding to recombinant PD-L1 protein.
L1 binding peptides. (A) Computer stimulated
structural analysis of interactions between PD-L1 and
A B
either PD-L1Pep-1 (B) PD-L1Pep-2. The amino acid
residues that shares the homology with PD-1 are
marked in red. The Q3 and K7 of PD-L1Pep-1 and R3
C and R7 of PD-L1Pep-2 appears to fit into the binding
interface with PD-L1.
Conclusion
We identified a PD-L1 binding peptides using a T7 phage peptide library. These peptides enhanced the
antitumor responses by decreasing the number of regulatory T cells in the tumor microenvironment.
Combination therapy of PD-L1 binding peptides has effectively enhanced the antitumor efficacy in
syngeneic CT26 tumor model.
Figure 3. Internalization of PD-L1.(A-B) Confocal microscopic image of PD-L1 at the cell surface and the References
internalization of PD-L1Pep-1 and PD-L1Pep-2 into the cytoplasm of CT26 cells.(C)Mean fluorescence
intensity determine using Image J software, for the evaluation of PD-L1 levels at the cell surface after
incubation of PD-L1Pep-1,PD-L1Pep-2 and anti-PD-L1 antibody for 1 or 24 h. • Zak KM, Kitel R, Przetocka S, Golik P, Guzik K, Musielak B, et al. Structure of the Complex of Human
Programmed Death 1, PD-1, and Its Ligand PD-L1. Structure. 2015;23:2341-8.
• Butte MJ, Keir ME, Phamduy TB, Sharpe AH, Freeman GJ. Programmed death-1 ligand 1 interacts
specifically with the B7-1 costimulatory molecule to inhibit T cell responses. Immunity. 2007;27:111-22.