
Page 129 - D. Cancer biology
P. 129
Anti-tumor Effects of Persimmon Leaves(Diospyros kaki) Extract via PDGFR-Rac-JNKs pathway
1
1
Heon-Su Kim , Jung-Soo Suh , Yoon-Kwan Jang , Sang-Hyun Ahn , Ganesan Raja and Tae-Jin Kim 1, 2*
2
1
1
1 Department of Integrated Biological science, Pusan National Unversity, Pusan 46241, Korea (Republic of)
2 Department of Biological Sciences, Pusan National Unversity, Pusan 46241, Korea (Republic of)
BACKGROUND AIM
The persimmon leaves are well known for potential beneficial effects, including
ROS elimination, lipid circulation, neuronal protection. However, their biological
and/or biochemical pathways are not well understood at the cellular level. Herein,
we found that a high concentration of ethanol extract of Diospyros kaki (EEDK)
treatment can cause cancer cell death, and inhibit cell proliferation. In particular,
HepG2 (hepatocellular carcinoma cell line) is more vulnerable to EEDK
administration than HEK293 (human embryonic kidney cell line). Using
fluorescence resonance energy transfer (FRET) technology, we first observed that
EEDK stimulates PDGFR-Rac signaling cascade in living cells. It was further
revealed that JNKs, downstream of PDGFR-Rac pathway, was activated by EEDK.
In contrast, JNK-downstream inhibitors, such as CoCl2, T-5224 and Pepstatin A,
attenuated the EEDK-inducing cell death. Thus, our results indicate that PDGFR-
Rac-JNK signaling triggered by EEDK leads to cancer cell death, suggesting the
persimmon leaves could be a promising anti-tumor agent.
Materials and Methods
• Ethanol Extract of Diospyros kaki(EEDK) was kindly provided by Dr. Sang Hoon Jung(Korea Institute of Science and Technology,
Republic of Korea). EEDK was dissolved in dimethyl sulfoxide(DMSO) and treated to cells. DMSO was used as a control, and
final DMSO concentration did not exceed 0.5%(v/v).
• HepG2 and HEK293A cells were cultured in Dulbecco’s modified Eagle’s medium supplemented with 10% Fetal Bovine
Serum, 100U/ml penicillin and 100μg/ml streptomycin and incubated in a humidified incubator of 95% O 2 and 5% CO 2 at 37℃.
• To investigate the cell’s viability, proliferation and protein’s activity, we performed Viability assay(WST-8 assay), Clonogenic
assay and Luciferase assay, respectively.
• Cells expressing several exogenous proteins were cultured in Confocal Dish. During imaging, medium was changed with CO 2 -
independent medium containing 0.5% FBS. Images were obtained by a Leica DMi8 microscope equipped with a charge-coupled
device(CCD) camera. LAS X software was used to acquire images, compute the emission ratio of ECFP/FRET. Specific region
of target cells were selected as a region of interest(ROI) to observe signals and implement a quantification.
RESULTS
(A) (B) Time Kras PDGFR Biosensor (A) (B)
120 * *** ** H E K 293A 120 * ** *** *** ** H ep G 2 (min) 0 10 20 30 40 5 4 C o n tro l ** H E K 293A 2.0 1.5 C o n tro l ** H ep G 2
#
#
**
% V ia b ility o f c e lls 80 60 40 % V ia b ility o f c e lls 80 60 40 Control 1.5 FRET ratio A P -1 R e lative L u c ifera se ac tivity 3 2 A P -1 R e lative L u c ifera se ac tivity 1.0 0.5
50 µ g /m l E E D K
50 µ g /m l E E D K
100
100
(A)
0 20 20 0 (B) 20μm 2.0 0 1 0 0.0
C ontrol 0 .1 1 10 50 75 100 C ontrol 0 .1 1 10 50 75 100 (C) (D)
EED K (µ g /m l) EED K (µ g /m l) EEDK FRET ratio 1.5 C o n tro l H E K 293A 1.5 C o n tro l H ep G 2
(C) EEDK (μg/ml) 50 µ g /m l E E D K 50 µ g /m l E E D K
20μm
0.65 1.0 1.0
Control 50 100 (C) 1 .6 C o n tro l (D) C o n tro l K r as P D G F R B io sen so r N F A T R e lative L u c ifera se ac tivity 0.5 ** N F A T R e lative L u c ifera se ac tivity 0.5
N orm a liz e d C F P /FR E T ra tio 1 .4 1 .2 E ED K 1 .5 1 .0 E ED K * 0.0 0.0 **
HEK293A 1 .0 N orm a liz e d C F P /FR E T ra tio 0 .5 Figure 5 Effects of EEDK on DNA binding activity of AP-1 and NFAT. (A-B) AP-1 activity
of (A) HEK293A and (B) HepG2 cells exposed to Control(0.5% DMSO) and
0 .8
D) NFAT activity of (C) HEK293A and (D) HepG2 cells exposed to Control(0.5% DMSO)
0
6
8 10 12 14 16 18 20 22 24 26 28 30 32 34 36 38 40
2
4
T im e (m in ) K r as P D G F R B io sen so r 0 .0 0 m in 40m in EEDK(50μg/ml) for 24h. Cells were transfected with 3xAP1pGL3 (40342, addgene). (C-
and EEDK(50μg/ml) for 24h. Cells were transfected with pGL3-NFAT luciferase(17870,
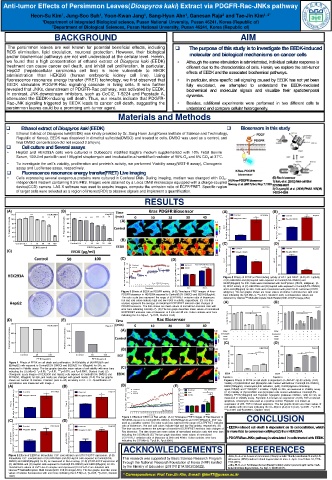
Figure 3 Effects of EEDK on PDGFR activity. (A-B) Time-lapse FRET images of Kras- addgene). The bar graphs shown are mean values of relative Luminescence with error
PDGFR biosensor in HEK293A exposed to Control(0.5% DMSO) and EEDK(50μg/ml). bars indicating the S.E.M(n=3, **p<0.01, Student t test). Luminescence values are
The color scale bars represent the range of ECFP/FRET emission ratio of biosensors. detected by Glomax TM Multi+Microplate Multi Reader(9301-010;Promega,USA)
HepG2 Hot and cold colors indicate high and low PDGFR activity, respectively. (C) The time (A) (B)
courses represent the average of nomalized ECFP/FRET emission ratio changes of
PDGFR biosensor. The dots shown are mean values of normalized emission ratio with 150 H E K 293A 150 H ep G 2
error bars indicating S.E.M(n=7). (D) The bar graph describes mean values of normalized
ECFP/FRET emission ratio of biosensor at 0 min and 40 min. It also contains error bars # # **
indicating the S.E.M(n=7, *p<0.05, Student t test) 100 100 ** *
(D) (E) Time Rac Biosensor % V ia b ility o f c e lls % V ia b ility o f c e lls 50
300 200 H ep G 2 (min) 50
H E K 293A 150 (A) 0 10 20 30 40 0.48 EEDK 0 - - - + - + + + - - EEDK 0 - - - + - + + + - -
N um be r of c o lon ie s 200 N um be r of c o lon ie s 100 50 Control 20μm 0 FRET ratio Anisomycin - - - - + - - - + - - - + - - + - - + - - - - + + + - - + + Anisomycin - - - - + - - - + - - - + - - + - - - + - - - + + + - - + +
CoCl2
CoCl2
T-5224
T-5224
(D)
(C)
100
0 0 (B) 20μm 0.85 150 ** * ** * H E K 293A 150 # * H ep G 2
C ontrol 50 100 C ontrol 50 100 EGF FRET ratio 100 100
EED K (µ g /m l) EED K (µ g /m l) % V ia b ility o f c e lls % V ia b ility o f c e lls
Figure 1. Effects of EEDK on cell death and proliferation. (A-B)Viability of (A)HEK293A and 50 50
(B)HepG2 cells exposed to Control(0.5% DMSO) and EEDK(0.1 to 100μg/ml) for 24h, as 0
measured in Viability assay. The bar graphs describe mean values of cell viability with error bars (C) 1.05
indicating the S.E.M(n=3, *p<0.05, **p<0.01, ***p<0.001, and # p<0.0001, Student t test) (C) 0 0
Clonogenic assay images of HEK293A and HepG2 cells exposed to Control(0.5% DMSO) and EEDK FRET ratio EEDK - + + - EEDK - + + -
EEDK(50, 100μg/ml) for 36h, and media are changed with growth media. (D-E) The bar graphs Pepstatin A - - + + Pepstatin A - - + +
shown are number of colonies. Colonies’ pixel is >20, circularity is 0.2 - 1.0 . Quantification of 20μm Figure 6 Effects of EEDK on cell death is dependent on JNK-AP-1/p-53 activity. (A-B)
cell colonies was measured with Image J. 0 Viability of (A)HEK293A and (B)HepG2 cells treated with/without Control(0.5% DMSO),
(A) 2 .5 C o n tro l * H E K 293A (B) 2 .0 C o n tro l * H ep G 2 (D) 3 .0 2 .5 C o n tro l (E) 3.5 3.0 C o n tro l R ac B io se n s o r EEDK(100μg/ml), Anisomycin(JNK activatior, 4μM), CoCl2(Hypoxia mimicking
agent,150μM) and T-5224(AP-1 inhibitor, 10μM) for 24h, as measured in Viability assay.
R elative F lu o re sc en ce In te n s ity 1 .0 R elative F lu o re sc en ce In te n s ity 0 .5 1 .0 R ac B io se n s o r 1.0 0.5 cell viability with error bars indicating the S.E.M(n=4 (A,B) or 3 (C,D), *p<0.05 , **p<0.01,
(C-D) Viability of (A)HEK293A and (B)HepG2 cells treated with/without Control(0.5%
EG F
#
EG F
E ED K
#
DMSO), EEDK(100μg/ml) and Pepstatin A(aspartic proteases inhibitor, 1μM) for 24h, as
apoptosis. Anisomycin was used as a positive control. Pepstatin A is known as
Fluo -3 2 .0 1 .5 50 µ g /m l E E D K Fluo -3 1 .5 1 .0 50 µ g /m l E E D K N orm a liz e d C F P /FR E T ra tio 2 .0 1 .5 N orm a liz e d C F P /FR E T ra tio 2.5 2.0 1.5 E ED K ** measured in Viability assay. Pepstatin A is known as suppressor of p53, TNF-α induced
suppressor of p53, TNF-α induced apoptosis. The bar graphs shown are mean values of
***p<0.001 and # p<0.0001, Student t test)
0.0
4
6
0
2
8 10 12 14 16 18 20 22 24 26 28 30 32 34 36 38 40
40m in
0m in
T im e (m in )
(C) 0 .5 0 .0 (D) 0 .0 Figure 4 Effects of EEDK on Rac activity. (A-C) Time-lapse FRET images of Rac bisensor in CONCLUSION
HEK293A exposed to Control(0.5% DMSO), EEDK(50μg/ml) and EGF(100ng/ml). EGF was
2 .5 2 .0 C o n tro l * H E K 293A 2 .5 2 .0 C o n tro l ** H ep G 2 used as a positive control. The color scale bars represent the range of ECFP/FRET emission
ratio of biosensors. Hot and cold colors indicate high and low Rac activity, respectively. (D)
The time courses represent the average of nomalized ECFP/FRET emission ratio changes of
50 µ g /m l E E D K
50 µ g /m l E E D K
β T rC P-EYF P R elative F lu o re sc en ce In te n s ity 1 .5 1 .0 0 .5 β T rC P-EYF P R elative F lu o re sc en ce In te n s ity 1 .5 1 .0 Rac biosensor. The dots shown are mean values of normalized emission ratio with error bars
indicating the S.E.M(n=8) (E) The bar graph describes mean values of normalized
ECFP/FRET emission ratio of biosensor at 0min and 40min. It also contains error bars
indicating the S.E.M(n=8, **p<0.01, # p<0.0001)
REFERENCES
0 .5
0 .0
0 .0
Figure 2 Effects of EEDK on intracellular Ca 2+ concentration and βTrCP-EYFP expression. (A-B) ACKNOWLEDGEMENTS Kim, K.-A. et al. Leaves of persimmon (Diospyros kaki Thunb.) ameliorate N-methyl-N-
Intracellular Ca 2+ concentration of (A) HEK293A and (B) HepG2 cells exposed to Control(0.5% This research was supported by Basic Science Research Program nitrosourea (MNU)-induced retinal degeneration in mice. J. Agric. Food Chem. 63, 7750–
DMSO) and EEDK(50μg/ml) for 8h, as measured in Fluo-3 assay. (C-D) βTrCP-EYFP expression of through the National Research Foundation of Korea (NRF) funded 7759 (2015).
(C) HEK293A and (D) HepG2 cells exposed to Control(0.5% DMSO) and EEDK(50μg/ml) for 24h. Ahn, H. R. et al. Persimmon leaves (Diospyros kaki) extract protects optic nerve crush-
Fluorescence values of Ca 2+ -Fluo-3 complex and expressed βTrCP-EYFP are detected with by the Ministry of Education (2017R1D1A1B03035622). induced retinal degeneration. Sci. Rep. 7, 46449 (2017).
Glomax TM Multi+Microplate Multi Reader(9301-010;Promega,USA). The bar graphs describe mean
values of relative fluorescence with error bars indicating the S.E.M(n=3, *p<0.05, **p<0.01, Student
t test)