Page 321 - 2020년김해시통계연보
P. 321

Transportation·Tourism and Information Communication              319


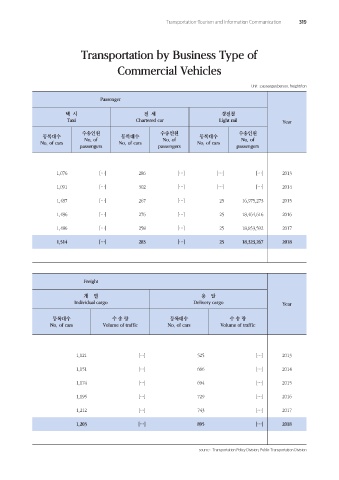
                             Transportation by Business Type of

                                          Commercial Vehicles


                                                                                         Unit : passenger/person, freight/ton

                                    Passenger

                        택  시                        전  세                       경전철
                         Taxi                    Chartered car                Light rail            Year

                              수송인원                       수송인원                        수송인원
                등록대수           No. of       등록대수          No. of       등록대수           No. of
               No. of cars                 No. of cars                No. of cars
                             passengers                  passengers                 passengers


                     1,076          […]           286           […]           […]          […]      2013

                     1,091          […]           302           […]           […]          […]      2014

                     1,487          […]           267           […]            25      16,975,273   2015

                     1,486          […]           276           […]            25      18,464,616   2016

                     1,486          […]           258           […]            25      18,853,592   2017

                     1,514          […]           283           […]            25      18,323,267   2018


                              Freight

                              개    별                                    용    달
                           Individual cargo                          Delivery cargo                 Year

                   등록대수                 수 송 량                등록대수                 수 송 량
                   No. of cars       Volume of traffic      No. of cars       Volume of traffic


                            1,121                 […]                  525                 […]      2013

                            1,151                 […]                  666                 […]      2014

                            1,174                 […]                  694                 […]      2015

                            1,195                 […]                  729                 […]      2016

                            1,212                 […]                  743                 […]      2017

                            1,203                 […]                  895                 […]      2018


                                                                       source : Transportation Policy Division, Public Transportation Division
   316   317   318   319   320   321   322   323   324   325   326