
Page 189 - 2020년김해시통계연보
P. 189
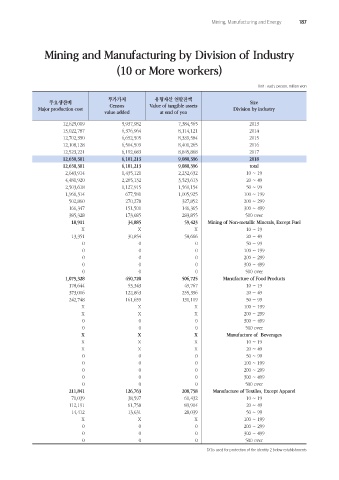
Mining, Manufacturing and Energy              187


                 Mining and Manufacturing by Division of Industry

                                          (10 or More workers)


                                                                                            Unit : each, person, million won

                                       부가가치            유형자산 연말잔액
                  주요생산비                                                                  Size
              Major production cost     Census        Value of tangible assets     Division by industry
                                      value added        at end of yea
                        12,625,009          5,937,982           7,384,565                2013
                        13,022,787          6,376,964           8,114,121                2014
                        12,702,350          6,652,505           8,339,584                2015
                        12,108,128          6,504,509           8,401,265                2016
                        12,523,221          6,192,683           8,845,868                2017
                        12,650,301          6,101,213           9,080,396                2018
                       12,650,301           6,101,213           9,080,396                total
                        2,643,914           1,435,121           2,232,632              10 ~ 19
                        4,481,920           2,265,132           3,523,613              20 ~ 49
                        2,503,618           1,127,915           1,560,154              50 ~ 99
                        1,966,314            677,581            1,005,925              100 ~ 199
                         502,860             270,278             327,852               200 ~ 299
                         166,347             151,501             146,365               300 ~ 499
                         385,328             173,685             283,855               500 over
                          18,911              34,885              59,423   Mining of Non-metallic Minerals, Except Fuel
                              X                  X                   X                 10 ~ 19
                          13,351              30,854              58,666               20 ~ 49
                              0                   0                   0                50 ~ 99
                              0                   0                   0                100 ~ 199
                              0                   0                   0                200 ~ 299
                              0                   0                   0                300 ~ 499
                              0                   0                   0                500 over
                        1,079,328            450,720             506,725       Manufacture of Food Products
                         178,644              53,343              49,767               10 ~ 19
                         373,006             122,863             255,396               20 ~ 49
                         242,748             161,659             131,109               50 ~ 99
                              X                  X                   X                 100 ~ 199
                              X                  X                   X                 200 ~ 299
                              0                   0                   0                300 ~ 499
                              0                   0                   0                500 over
                              X                  X                   X           Manufacture of  Beverages
                              X                  X                   X                 10 ~ 19
                              X                  X                   X                 20 ~ 49
                              0                   0                   0                50 ~ 99
                              0                   0                   0                100 ~ 199
                              0                   0                   0                200 ~ 299
                              0                   0                   0                300 ~ 499
                              0                   0                   0                500 over
                         211,841             126,763             208,758    Manufacture of Textiles, Except Apparel
                          71,039              38,597              61,432               10 ~ 19
                         112,191              61,758              89,904               20 ~ 49
                          14,412              13,631              28,039               50 ~ 99
                              X                  X                   X                 100 ~ 199
                              0                   0                   0                200 ~ 299
                              0                   0                   0                300 ~ 499
                              0                   0                   0                500 over
                                                                          [X] is used for protection of the identity 2 below establishments