


Page 295 - ebook
P. 295
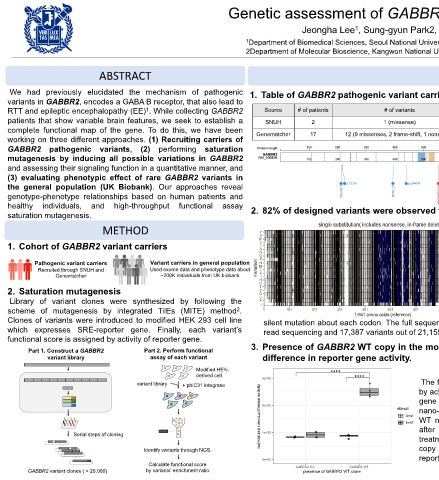
Genetic assessment of GABBR2 in human brain development
Jeongha Lee , Sung-gyun Park2, Byung Joon Hwang2, Murim Choi 1
1
1 Department of Biomedical Sciences, Seoul National University College of Medicine, Seoul, Republic of Korea
2Department of Molecular Bioscience, Kangwon National University College of Biomedical Science, Seoul, Republic of Korea
ABSTRACT RESURTS
We had previously elucidated the mechanism of pathogenic 1. Table of GABBR2 pathogenic variant carriers. 4. GABBR2 gene based collapsing analysis was performed
variants in GABBR2, encodes a GABA B receptor, that also lead to Recruited patients presented
RTT and epileptic encephalopathy (EE) . While collecting GABBR2 Source # of patients # of variants wide spectrum of phenotypes with various application of collapsing models.
1
patients that show variable brain features, we seek to establish a SNUH 2 1 (missense) from epileptic encephalopathy UK biobank cohort was pruned
complete functional map of the gene. To do this, we have been Genematcher 17 12 (9 missenses, 2 frame-shift, 1 nonsense) and developmental disability to UK Biobank Cohort
working on three different approaches. (1) Recruiting carriers of Rett-like traits and autism. UK Biobank Cohort Diagnose ICD-10 of by considering sex, cryptic
relatedness, population stratifi-
GABBR2 pathogenic variants, (2) performing saturation 200K exomes 437,506 individuals
(.pvcf, .plink)
mutagenesis by inducing all possible variations in GABBR2 Previously cation and marker QC.
published
Rare variant association test
Pruned cohort
and assessing their signaling function in a quantitative manner, and variants 183,218 individuals was performed by collapsing
(3) evaluating phenotypic effect of rare GABBR2 variants in were also 3
the general population (UK Biobank). Our approaches reveal included in Extract markers of qualifying variants (QV) of
GABBR2
GABBR2. And associations of
VEP annotation
genotype-phenotype relationships based on human patients and this figure. (Effcet, gnomAD,
healthy individuals, and high-throughput functional assay 2. 82% of designed variants were observed from the library. REVEL, MTR etc) QV QV … QV Extract neurologic each set of QVs and individuals’
related categories
saturation mutagenesis. 1 2 8 57 traits (case ≥ 20) ICD10 assignment was calcul-
ated through Fisher’s exact test.
METHOD Y single substitution( includes nonsense, in-frame deletion) Saturation Fisher’s exact test
X
W mutagenesis had
1. Cohort of GABBR2 variant carriers V
T
S
R been done in an DISCUSSION
Q type amino acid level, by
P
Pathogenic variant carriers Variant carriers in general population M C
N
Recruited through SNUH and Used exome data and phenotype data about mutation L E generating 19 To complete the functional map of GABBR2, library of variants will be
Genematcher ~200K individuals from UK biobank K I substitutions, 1
H T
G introduce to the given cell line and quantitative functional score will be
F
2. Saturation mutagenesis E stop-gain, 1 in- assigned. With comparison and complement from public DB (protein
D
4
Library of variant clones were synthesized by following the C - frame deletion and structure ), the result will shed light on understanding pleiotropic function of
A
2
scheme of mutagenesis by integrated TilEs (MITE) method . 1 101 201 301 1-941 amino acids (reference) 601 701 801 901 at least 1 GABBR2 on brain development.
401
501
Clones of variants were introduced to modified HEK 293 cell line silent mutation about each codon. The full sequence of clones were read by Pacbio HiFi long a GABA B2 GABA B1b b GABA B2 GABA B1b a TM1 TM7 TM6 TM4 GABA B1 d WT GABA B1
GABA (H579A/E677A)
B2
GABA (H572A/E673A)
B1
which expresses SRE-reporter gene. Finally, each variant’s read sequencing and 17,387 variants out of 21,155 (82%) were detected. Table of functional score TM5 TM3 1,500 WT GABA B2
WT GABA
B1
WT GABA
B2
functional score is assigned by activity of reporter gene. VFT TM2 TM2 1,000
VFT
CGP55845
CGP
3. Presence of GABBR2 WT copy in the modified cell line displays significant variant functional score pathogenicity TM3 TM5 TM1 IP 1 per well (nM)
Part 1. Construct a GABBR2 Part 2. Perform functional mutant 1 5 Benign GABA B2 TM5 500
variant library assay of each variant difference in reporter gene activity. TM4 mGlu5 0
mutant 2
-2
Loss of function
0.2 0.4 0.6 0.8 1.0
ECL2L2
Phospholipid EC L in k b c TM6 TM7 TM1 0 Normalized GABA
TM1
Linker
B1
TM5
TM5
F67
0
Modified HEK- **** mutant 3 2 Intermediate TM 5 F670 TM 5 TM 3 H579 TM 5 e surface expression
TM5
TM3
H579
E673
F669
derived cell **** … … … F673 F66 9 E673 8
F67
3
3e+09 TM5 TM5 6
TM5
TM5
TM1
TM1
variant library + phiC31 integrase The functionality of each variant will be measure TM1 TM2 TM3 TM6 TM1 7TM Y576 Fold over basal IP 1 4
TM4
TM4
TM2
Y576
TM6
normalized nanoLuciferase activity
TM3
TM7
by activity of SRE dependent expressing reporter TM7 TM3 2
TM
3
5
TM
H572
TM
3
TM3 TM5 E677 H572 TM3 0
E677
6
TM3
gene (nano-luciferase and mTagBFP). Activity of c 10 GABA (6.3 ng) + d 10 GABA (!627–634) + –10 –9 –8 –7 –6 –5 –4 –3
log[GABA (M)]
B1
B1
2e+09 GABA (6.3 ng) WT GABA
8
B2
B2
stimuli nano-luciferase was measured about GABBR2 REFERENCE GABA (3.1 ng) + 8 WT GABA + Fig. 2 | TM3 and TM5 stabilize an inactive-state dimer interface of GABA
B
B1
B1
B2
0mM Fold over basal IP 1 6 GABA (3.1 ng) Fold over basal IP 1 6 GABA (!631–638) 7TM. a, Inactive-state GABA 7TMs (GABA , teal; GABA , tan) are in closer
GABA (1.6 ng) +
B2
B
B1
B2
B1
GABA (1.6 ng)
14
B2
B1
1mM WT negative and positive cell line respectively, 4 GABA (0.8 ng) + 4 WT GABA + proximity than those of inactive mGlu5 (purple) (PDB 6N52 ), top-down view.
WT GABA
B1
b, The GABA and GABA interface is stabilized through hydrophobic
B2
GABA (0.8 ng)
B1
B2
after 7hr incubation from 1mM balcofen 1. Yongjin Yoo et al., GABBR2 mutations determine phenotype in rett syndrome and epileptic interactions along the!TM5 helices, and by polar residues on the intracellular
2
2
B2
GABA (!627–634) +
GABA (6.3 ng)
B1
B1
GABA (!631–638)
Serial steps of cloning 1e+09 encephalopathy. (2017, Ann. Neurol.) 0 0 –9 –8 –7 –6 –5 –4 –3 GABA (3.6 ng) 0 0 –9 –8 –7 –6 –5 –4 –3 B2 side of TM3 and TM5 (boxed). c, Polar interaction residues from the
B2
treatment. As a result, cells with GABBR2 WT log[GABA (M)] log[GABA (M)] intracellular side of the receptor. GABA E677 is shown for perspective;
B2
… 2. Alexandre Melnikov et al., Comprehensive mutational scanning of a kinase in vivo reveals substrate- however, the map density for this residue was insufficient for high-confidence
Fig. 1 | Cryo-EM map and model of the full-length GABA receptor
Identify variants through NGS. copy expressed significantly high activity of dependent fitness landscapes. (2014, Nucleic Acids Res.) B B modelling of its side chain. IP accumulation assays illustrate differences in the
heterodimer in inactive state. a, b, GABA receptor cryo-EM map (a) and
1
, teal; GABA , tan; GDN micelle, white; CGP55845,
ribbon diagram (b) (GABA
… reporter gene. 3. Slave Petrovski et al., An exome sequencing study to assess the role of rare genetic variation in basal activity (d) and GABA response (e) of GABA TM3 and TM5!mutants.
B
B2
B1b
0e+00
Calculate functional score GABBR2 KO GABBR2 WT pulmonary fibrosis. (2017, Am. J. Resp. Crit.) gold; phospholipids, orange; glycosylation, blue and pink). Elongated densities
at the 7TM interface are probably lipid or detergent molecules (yellow).
GABBR2 variant clones ( > 20,000) by variants’ enrichment ratio. presence of GABBR2 WT clone 4. Makaia M. Papasergi-Scott et al., Structure of metabotropic GABA receptor. (2020, Nat) B1 B2 observe a slight downward rotation in β-sheet orientation (Extended
increases with higher levels of cotransfected GABA and GABA
B
c, GABA E
max
plasmid DNA. d, ECL2 truncation of either subunit of GABA increases E max of Data Fig.!5). To further examine the involvement of ECL2 in receptor
B
GABA-stimulated response when compared to cotransfected wild-type (WT) activation, we used a functional assay with a chimeric Gα , in which
o/q
receptors of similar surface expression (Extended Data Fig.!6a); ECL2 the G -coupled GABA receptor can couple to the PLC pathway 3,18 . We
B
i/o
shortening of both protomers inhibits activity. For sample sizes, replicability, measured the accumulation of the downstream metabolite inositol
sample collection and descriptions of error bars for all figures, see ‘Statistics monophosphate (IP ) by LiCl using an established assay , and thereby
19
and reproducibility’ in Methods. 1
monitored the GABA-stimulated and basal receptor activity (Fig.!1c).
ECL2 shortening was generally inhibitory to the proper membrane
trafficking of the subunits of GABA . Accordingly, we normalized the
B
of the extracellular region at a resolution of 3.5!Å provided improved transfected DNA to obtain similar expression levels between con-
density for the linker regions, and assisted with modelling (Extended structs (Extended Data Fig.!6a). The partial deletion of the ECL2 of
Data Fig.!1). The asymmetric protomers (GABA and GABA ) share a GABA (residues 627–634)—comprising the unstructured tip of the
B1
B1
B2
similar secondary structure and arrangement, but are distinguished loop nearest the VFT—produced an increase in basal activity, but did
by differential glycosylation and a well-resolved ligand density within not affect the GABA maximal response (E max ) when expressed with
the GABA VFT that is absent in GABA (Fig.!1, Extended Data Figs.!3, wild-type GABA (Fig.!1d). These findings indicate that abrogating the
B2
B2
B1
4a). The upper VFT lobes of GABA form a junction, whereas the lower ECL2–linker allows flexibility in the GABA VFT relative to the rest of
B1
B
VFT lobes are separated by about 20!Å (Fig.!1, Extended Data Fig.!3). The the receptor dimer, resulting in activation through the GABA VFT–
B2
20
CGP55845 ligand adopts a horseshoe-like conformation (which was 7TM route in the absence of agonist . By contrast, the partial deletion
17
confirmed by GemSpot ) that closely resembles the crystal structure of of the ECL2 of GABA (residues 631–638) did not affect basal activity,
B2
the GABA VFT in complex with the inhibitor CGP54626 12,16 (Extended but produced an increase in GABA E max and a decrease in GABA potency
B1
Data Fig.!3). We also observe a small spherical density in GABA that when compared to wild-type receptor expressed at similar levels at
B1
appears to be interacting with the backbone carbonyl of G277, in addi- the cell surface—indicating that the ECL2 of GABA may be partially
B2
tion to several anionic groups and a tyrosine, which raises the possibility inhibitory (Fig.!1d, Extended Data Fig.!6a). When both receptors contain
that a divalent cation resides!in that location (Extended Data Fig.!3e). a truncated ECL2, we observed a decrease in GABA E max , which sug-
Inactive GABA assumes an overall morphology similar to that of gests that at least one VFT must be structurally coupled through the
B
14
the apo-state structure of mGlu5 ; the most substantial differences extended ECL2–linker for full activation (Fig.!1d). Collectively, these
between these two arise within the linker region (Fig.!1b). Bridging the data support a bimodal transactivation mechanism of GABA , in which
B
VFT and 7TM, an approximately 20-residue linker forms a β-sheet in agonist binding on the GABA receptor can proceed from the GABA
B1
B1
conjunction with the ECL2. Notably, the length of the GABA receptor VFT down to the GABA 7TM region to enact changes in GABA that
B2
B1
B
ECL2 is nearly twice that of mGlu5 (Fig.!1, Extended Data Fig.!4b). In the promote G-protein activation, and also activate the GABA 7TM directly
B2
absence of cysteine-rich domains, the β-sheet structure of the GABA through the GABA VFT.
B
B2
linker in complex with ECL2 orders this region, with the additional Besides those of the VFT and the C-terminal coiled–coil, we observe
ECL2 length thus allowing coupling between the 7TM and VFT for sig- that inactive GABA forms an additional dimer interface between trans-
B
nal transduction. Our molecular dynamics simulations support the membrane (TM)3 and TM5 from each monomer of the heterodimer
structural stabilization of the linker through the β-sheet formation. (Figs.!1, 2). The interface is formed by ionic interactions between resi-
After 200!ns, in all simulations the linker and ECL2 continued to adopt dues on the intracellular side of each receptor—H572 in TM3 and E673
a stable structure even in the absence of the VFTs, although we did in TM5 of GABA , and H579 in TM3 and E677 in TM5 of GABA —and is
B1
B2
Nature | Vol !"# | $% August &'&' | 311

