


Page 3 - ebook
P. 3
Identification of causal genes for nonalcoholic fatty liver disease using
                                            multi-omics based single-cell analysis

                                                         1*
                                               Sung Eun Hong , Kyung-Suk Suh , Won Kim , Murim Choi 1
                                                                             3
                                                                      2
                                    1. Department of Biomedical Sciences, Seoul National University College of Medicine, Seoul, Republic of Korea
                                        2. Department of Surgery, Seoul National University College of Medicine, Seoul, Republic of Korea
                     3. Department of Internal medicine, Seoul National University College of Medicine, Seoul Metropolitan Government Boramae Medical Center, Seoul, Republic of Korea
                              ABSTRACT                                           SAMPLES & METHODS
     Background and aims                                                  Data generation         snRNA-seq analysis
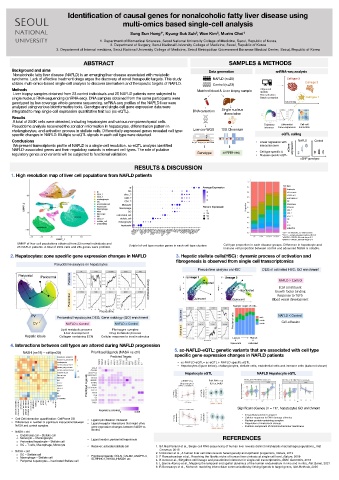
      Nonalcoholic fatty liver disease (NAFLD) is an emerging liver disease associated with metabolic
     syndrome. Lack of effective treatment drugs urges the discovery of novel therapeutic targets. This study   NAFLD (n=25)  Cell type 2
     utilizes multi-omics-based single-cell analysis to discover biomarkers and therapeutic targets of NAFLD.  Control (n=23)  Cell type 3
     Methods                                                          Matched blood & Liver biopsy sample  Alignment
      Liver biopsy samples obtained from 23 control individuals and 25 NAFLD patients were subjected to   QA/QC
                                                                                            Normalization
     single nucleus RNA-sequencing (snRNA-seq). DNA samples obtained from the same participants were   Batch correction  Cell type 1
     genotyped by low coverage whole genome sequencing. snRNA-seq profiles of the NAFLD liver were   Clustering
     analyzed using various bioinformatics tools. Genotype and single-cell gene expression data were
     integrated to map single-cell expression quantitative trait loci (sc-eQTL).  DNA extraction  Single nucleus
                                                                                dissociation
     Results
     A total of 250K cells were detected, including hepatocytes and various non-parenchymal cells.
                                                                                                          Cell-cell
                                                                                                    Differential
     Pseudotime analysis recovered the zonation information in hepatocytes, differentiation pattern in   Trajectory   Gene expression  interaction
                                                                                              inference
     cholangiocytes, and activation process in stellate cells. Differentially expressed genes revealed cell type-  Low-cov WGS  10X Chromium
     specific changes in NAFLD. Multiple sc-eQTL signals in each cell type were detected.  G        eQTL calling
                                                                         A
                                                                     <
                                                                           <
     Conclusions                                                     ACGTTACCGGGAATTAA     • Linear regression with   NAFLD  Control
      We present transcriptomic profile of NAFLD in a single-cell resolution. sc-eQTL analysis identified   interaction term
     NAFLD-associated genes and their regulatory variants in relevant cell types. The role of putative   • Cell type specific &  eGene   expression
     regulatory genes and variants will be subjected to functional validation.  Genotype  snRNA-seq  • Disease specific eQTL
                                                                                                          eSNP genotype
                                                RESULTS & DISCUSSION
     1. High resolution map of liver cell populations from NAFLD patients


                                                                                                    *ctrl = no steatosis, no inflammation
                                                                                                    *NAFL = simple steatosis without NASH
                                                                                                    *eNASH = NASH, fibrosis stage 0-1
                                                                                                    *aNASH = NASH, fibrosis stage 2-4
       UMAP of liver cell populations obtained from 23 normal individuals and   Dotplot of cell type marker genes in each cell type clusters  Cell type proportion in each disease groups. Difference in hepatocyte and
       25 NAFLD patients. A total of 249k cells and 25k genes were profilled.   immune cell proportion between control and advanced NASH is notable.
     2. Hepatocytes: zone specific gene expression changes in NAFLD  3. Hepatic stellate cells(HSC) : dynamic process of activation and
                                                               fibrogenesis is observed from single cell transcriptomics
                    Pseudotime analysis on hepatocytes
                                                                      Pseudotime analysis on HSC  DEG of activated HSC: GO enrichment
                          Periportal                                    Activated                  /"'-%   $POUSPM
       Periportal
               Pericentral                                         Lineage 1    Lineage 2
                                                                                                   &$. DPOTUJUVFOU
                                                                                      Inactivated  (SPXUI GBDUPS CJOEJOH
                                                                                                  3FTQPOTF UP 5('C
                          Pericentral                                Quiescent     Quiescent     #MPPE WFTTFM EFWFMPQNFOU
                                                     Gene expression
                                    Pseudotime                                     Sample origin of cells
            PV                                                   Quiescent                         /"'-%   $POUSPM
                     Pericentral hepatocytes DEG: Gene ontology (GO) enrichment
             CV         NAFLD > Control  NAFLD < Control                           Fraction of cells  $FMM BEIFTJPO
                      Lipid metabolic process  Fibrinogen complex  Activated
                        Liver development  Drug metabolic process
          Hepatic lobule  Collagen containing ECM  Cellular response to insulin stimulus
                                                                                   Low pt  High pt
                                                                                          =
                                                                                    =
     4. Interactions between cell types are altered during NAFLD progression      Quiescent  Activated
                                                              5. sc-NAFLD-eQTL: genetic variants that are associated with cell type
         NASH (n=19) – ctrl (n=23)  Prioritized Ligands (NASH vs ctrl)
                                        Predicted Targets     specific gene expression changes in NAFLD patients
                                                               • sc-NAFLD-eQTL= sc-eQTL + NAFLD specific eQTL
                                                               • Hepatocytes (figure below), cholangiocytes, stellate cells, endothelial cells and immune cells (data not shown)
                                                                  Hepatocyte eQTL          NAFLD Hepatocyte eQTL
                                Prioritized Ligands           $:1 '     FYQSFTTJPO   IFQBUPDZUF   $:1 '     FYQSFTTJPO  #VML 3/" TFR
                                                                 TO3/" TFR
                                                                            (5&Y  CVML
                                                                                    Significant eGenes (n = 117, hepatocyte) GO enrichment
                                           0    0.005                                 •
                                                                                       Cellular response to DNA damage stimulus
     • Cell-Cell interaction quantification: CellPhone DB  • Ligand prioritization: Nichenet  $:1 7    FYQSFTTJPO  $:1 7    FYQSFTTJPO  • •  Intracellular protein transport
     • Differences in number of significant interactions between   • Ligand-receptor interactions that might drive   •  Nuclear protein-containing complex
                                                                                       Regulation of cholesterol storage
      NASH and control samples   gene expression changes between NASH vs              •  Extrinsic component of mitochondrial inner membrane
                                 control.
     • NASH > ctrl
       o Endothelial cell – Stellate cell
       o Monocyte – Cholangiocyte  • Ligand sender: pericentral hepatocyte     REFERENCES
       o Pericentral hepatocyte – Stellate cell
       o DC – T cells, Macrophage, Monocyte  • Receiver: activated stellate cell  1. SA MacParland et al., Single cell RNA sequencing of human liver reveals distinct intrahepatic macrophage populations,, Nat
                                                         Commun, 2018
     • NASH < ctrl                                      2. N Aizarani et al., A human liver cell atlas reveals heterogeneity and epithelial progenitors, Nature, 2019
       o DC – Stellate cell     • Prioritized ligands: OCLN, CALM2, ANGPTL3,
       o Macrophage – Stellate cell  SERPINC1, INHBA, HMGB1 etc  3. P Ramachandran et al., Resolving the fibrotic niche of human liver cirrhosis at single-cell level, Nature, 2019
       • Periportal hepatocytes – inactivated Stellate cell  4. K street et al., Slingshot: cell lineage and pseudotime inference for single-cell transcriptomics, BMC Genomics, 2018
                                                        5. L Garcia-Alonso et al., Mapping the temporal and spatial dynamics of the human endometrium in vivo and in vitro, Nat Genet, 2021
                                                        6. R Borowaeys et al., Nichenet: modeling intercellular communication by linking ligands to target genes, Nat Methods, 2020

