


Page 7 - ebook
P. 7
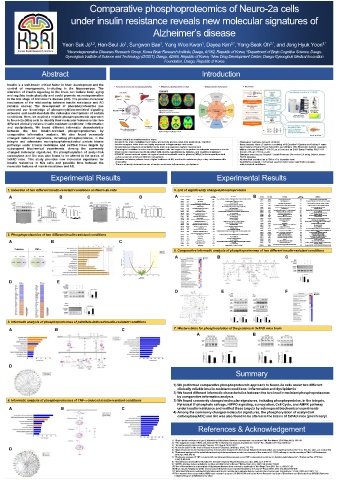
Comparative phosphoproteomics of Neuro-2a cells
under insulin resistance reveals new molecular signatures of
Alzheimer’s disease
Yeon Suk Jo , Han-Seul Jo , Sungwon Bae , Yang Woo Kwon , Dayea Kim , Yong-Seok Oh , and Jong Hyuk Yoon 1,*
3,*
1,2
1
2,*
1
1
1 Neurodegenerative Diseases Research Group, Korea Brain Research Institute, Daegu, 41062, Republic of Korea, Department of Brain-Cognitive Science, Daegu-
2
3
Gyeongbuk Institute of Science and Technology (DGIST), Daegu, 42988, Republic of Korea, New Drug Development Center, Daegu-Gyeongbuk Medical Innovation
Foundation, Daegu, Republic of Korea
Abstract Introduction
Insulin is a well-known critical factor in brain development and the
control of neurogenesis, in-cluding in the hippocampus. The Functions of insulin signaling pathway Metabolic dysregulation in AD Brain insulin resistance Workflow
alteration of insulin signaling in the brain can induce brain aging
and regulate brain plasticity and could promote neurodegeneration
in the late stage of Alzheimer’s disease (AD). The precise molecular
mechanism of the relationship between insulin resistance and AD
remains unclear. The development of phosphoproteomics has
advanced our knowledge of phosphorylation-mediated signaling
networks and could elucidate the molecular mechanisms of certain
conditions. Here, we applied a reliable phosphoproteomic approach
to Neuro-2a (N2a) cells to identify their molecular features under two
different clinically reliable insulin-resistant conditions: inflammation
and dyslipidemia. We found different informatic characteristics
between the two insulin-resistant phosphoproteomes by (A) Normal (B), Early AD, (C) Late AD
comparative informatics analysis. We also found commonly
changed molecular signatures, including phosphoproteins, in the
integrin and adenosine monophosphate-activated protein kinase • Human brain is an insulin-sensitive organ • 4 biological replicates for each condition
• Insulin in the brain modulates food intake, whole-body glucose level, lipid metabolism, cognition
pathways under insulin resistance and verified these targets by • Insulin receptors in the brain are highly expressed in hippocampus and cortex • Mass analysis: Nano-LC system consisting of Q Exactive™ Quadrupole-Orbitrap™ mass
subsequent biochemical experiments. Among the commonly • Insulin induces long-term potentiation in the brain and regulates memory improvement spectrometer (Thermo Fisher Scientific) and Ultimate 3000 RSLCnano system equipped
with an Acclaim PepMap TM 100 (75 mm x 2 cm) and an EASY-Spray PepMap RSLC C18
• Pathological condition in which insulin-dependent cells and organs fail to perform an adequate response to insulin
changed molecular signatures, the phosphorylation of acetyl-CoA • Brain insulin resistance reports in patient with obesity, hyperlipidemia, diabetes, and cognitive impairment Column (75 mm × 50 cm, 2 mm)
carboxylase and Src was also found to be altered in the brains of • FDG-PET shows reduced uptake of regional cerebral metabolic rate for glucose(CMRgl) in the temporal-parietal • Database searching by Sequest™ based Proteome Discoverer 2.4 using Uniprot mouse
FASTA database
cortex (shown as arrows) in MCI and AD patients
5xFAD mice. This study provides new molecular signatures for • Diabetes and obese patients have a higher incidence of AD, and insulin resistance plays a key role between this • All identified proteins had a FDR of <1% in peptide level
association
insulin resistance in N2a cells and possible links between the • There is clinically observed causes of insulin resistance: inflammation, dyslipidemia • Quantitative analysis : normalized spectral index based quantitative analysis
with statistical confidence
molecular features of insulin resistance and AD.
Experimental Results Experimental Results
1. Induction of two different insulin-resistant conditions on Neuro-2a cells 5. List of significantly changed phosphoproteins
A B C D A Accession Gene Symbol Description (Pal + Ins/Ins) Modifications B Accession Gene Symbol Description (TNF + Ins/Ins) Modifications
Log 2 Fold
Log 2 Fold
Q64337 Sqstm1 Sequestosome-1 3.86 Phospho [T269(100); T271(99.5); S330(100); S334(100); S363(98.7); S367(98.7); S368(98 P13595 Ncam1 Neural cell adhesion molecule 1 4.41 Phospho [S770(100); S774(100); S1005(100)]
.7)]
Q7TPV4 Mybbp1a Myb-binding protein 1A 3.99 Phospho [S1164(100); S1253(99.1); T1256(99.1); S1280(100)]
Q9QYC0 Add1 Alpha-adducin 3.80 Phospho [T610(99.1); T614(99.1); S724(100)]
Q61686 Cbx5 Chromobox protein homolog 5 3.69 Phospho [S14(99.6)] Q62093 Srsf2 Serine/arginine-rich splicing factor 2 3.79 Phospho [T25(99.4); S206(100); S208(100); S212(100)]
Signal-induced proliferation-associated 1-like protei
150 Q8C0T5 Sipa1l1 n 1 3.63 Phospho [S1528(100); S1624(100); S1626(100)] Q5SSI6 Utp18 U3 small nucleolar RNA-associated protein 18 homolog 3.55 Phospho [S114(100); S115(100); S118(100); S206(100)]
***
Prothymosin alpha
*** P26350 Ptma Tcea1 Transcription elongation factor A protein 1 3.35 3.35 Met-loss+Acetyl [N-Term]; Phospho [S2(100)]; Acetyl [N-Term] Q8BI84 Tpd52l2 Mia3 Transport and Golgi organization protein 1 homolog 3.55 3.48 Phospho [S1458(100); S1765(99.4)]
Phospho [S100(100)]
Tumor protein D54
P10711
Q9CYZ2
Phospho [S200(100)]
Cell Viability (% of control) 100 50 Q7TQH0 Atxn2l Osbp Oxysterol-binding protein 1 3.35 3.35 Phospho [S188(100); S191(100); T375(100); S377(99.5); S380(100); S383(100)] Q9DBC3 Cmtr1 Rbmx Cap-specific mRNA (nucleoside-2′-O-)-methyltransferase 1 3.48 3.41 Phospho [S27(99.4); S48(98.6); S50(100); S52(100); S54(100)]
Phospho [S109(100); S304(100); S337(99.4)]
Ataxin-2-like protein
Q3B7Z2
Q9WV02
Phospho [S208(100)]
RNA-binding motif protein, X chromosome
Q3UYV9
Phospho [S22(99.6)]
Bromodomain-containing protein 1
Phospho [S190(100)]
Q9DBY8
Q6P9Q6 Fkbp15 Ncbp1 Nuclear cap-binding protein subunit 1 3.27 3.19 Phospho [S1157(100); S1159(100)] G5E8P1 Brd1 Nvl Nuclear valosin-containing protein-like 3.26 3.26 Phospho [S128(100); S1052(100); S1055(100)]
FK506-binding protein 15
Nischarin
0 P20029 Hspa5 Endoplasmic reticulum chaperone BiP 3.10 Phospho [S650(98)] Q80TM9 Nisch Mxra7 Matrix-remodeling-associated protein 7 3.26 3.18 Phospho [S543(99.5); S548(99.7); S1373(100)]
Phospho [S79(100)]
Q9CZH7
BSA 100 200 400 Q8CH77 Nav1 Neuron navigator 1 3.01 Phospho [S1247(99.2)] Q99LJ0 Cttnbp2nl CTTNBP2 N-terminal-like protein 3.09 Phospho [S481(100); S556(100); S559(100); S562(100)]
palmitate (mM)
Q8CHW4 Eif2b5 Translation initiation factor eIF-2B subunit epsilon 3.01 Phospho [S540(100)] Q4JIM5 Abl2 Tyrosine-protein kinase ABL2 3.09 Phospho [S621(100); S632(99.5)]
Met-loss+Acetyl [N-Term]; Phospho [S2(99.2); T18(100)]; Acetyl [N-T
B1AY10 Nfx1 Transcriptional repressor NF-X1 –3.07 Phospho [S51(98.7); S81(100); S147(100); S149(98.6)] P43274 Hist1h1e Histone H1.4 –3.03 erm]
Q6ZQ88 Kdm1a Lysine-specific histone demethylase 1A –3.14 Phospho [S132(100); S138(100); S167(100)] A2A690 Tanc2 Protein TANC2 –3.03 Phospho [S1534(100); S1538(100)]
Q9WV02 Rbmx RNA-binding motif protein, X chromosome –3.29 Phospho [S208(100)] Q9EP82 Wdr4 tRNA (guanine-N(7)-)-methyltransferase non-catalytic subun –3.03 Phospho [S397(100)]
it WDR4
Q6DFV3 Arhgap21 Rho GTPase-activating protein 21 –3.36 Phospho [S874(100); T1621(100); S1623(100)]
P81122 Irs2 Insulin receptor substrate 2 –3.03 Phospho [S66(97.6)]
P68254 Ywhaq 14-3-3 protein theta –3.36 Phospho [S230(96)]
Q8C0T5 Sipa1l1 Signal-induced proliferation-associated 1-like protein 1 –3.13 Phospho [S1528(100); S1624(100); S1626(100); S1629(99.1)]
Q8BL97 Srsf7 Serine/arginine-rich splicing factor 7 –3.36 Phospho [S208(100); S210(100)]
51(100)]
Q5U4C3 Scaf1 Splicing factor, arginine/serine-rich 19 –3.48 Phospho [S510(100); S518(99.5); S676(100); S682(100); S691(100); S695(100); S821(10 P97868 Rbbp6 E3 ubiquitin-protein ligase RBBP6 –3.23 Phospho [S1179(100); S1329(100); S1644(98.4); S1646(98.4); S16
0)]
E9Q4F7 Ankrd11 Ankyrin repeat domain-containing protein 11 –3.33 Phospho [S1070(100); S1832(99); S1844(100)]
2. Phosphoproteomics of two different insulin-resistant conditions Q61029 Tmpo Lamina-associated polypeptide 2, isoforms beta/de –3.54 Phospho [S66(100); S67(100); T74(100); T159(98.6); S179(100); S183(100)] Q8BG09 Tmem184b SWI/SNF complex subunit SMARCC1 –3.41 –3.50 Phospho [S402(100); S403(100)]
Transmembrane protein 184B
Phospho [S327(100); S329(100)]
lta/epsilon/gamma
Smarcc1
P97496
Q8BK67 Rcc2 Protein RCC2 –3.54 Phospho [S48(95.5)] Q80Y17 Llgl1 Trim24 Lethal(2) giant larvae protein homolog 1 –3.65 –3.79 Phospho [S982(100); S986(100); S989(98.6)]
Phospho [S1026(100); S1029(100)]
Q64127
Transcription intermediary factor 1-alpha
O88286 Wiz Protein Wiz –3.60 Phospho [S1045(100); S1050(100)] Q8C8R3 Ank2 Ankyrin-2 –4.03 Phospho [S1699(100); S1700(100); S1703(100); S2824(100); S282
7(99.4); S3362(100)]
Phospho [S200(99)]
Tumor protein D54
A B C Q9CYZ2 Tpd52l2 Irs2 Insulin receptor substrate 2 –3.70 –3.85 Phospho [T55(99); S66(100); T517(100); T524(100); S556(100); S573(100); S616(99.5); S Q99PM3 Gtf2a1 Sdpr Transcription initiation factor IIA subunit 1 –4.19 –4.28 Phospho [S203(100); S204(100); S218(100); S293(100); S359(100);
Phospho [S318(100); S323(100)]
P81122
1089(100)]
Caveolae-associated protein 2
Q63918
P68369 Tuba1a Tubulin alpha-1A chain –4.36 Phospho [S439(100)] S363(100); T368(100)]
Q3UMU9-2 Hdgfrp2 Isoform 2 of Hepatoma-derived growth factor-related protein –4.28 Phospho [S365(100); S366(100); S627(100); S628(100); S638(100)]
O08784 Tcof1 Treacle protein –4.57 Phospho [S83(97); T1114(99.2); S1191(100)] 2
6. Comparative informatic analysis of phosphoproteomes of two different insulin-resistant conditions
A B C
D E
D E F
3. Informatic analysis of phosphoproteomes of palmitate-induced insulin-resistant conditions
A B C 7. Western blots for phosphorylation of the proteins in 5xFAD mice brain
A B
D
Summary
1) We performed comparative phosphoproteomic approach to Neuro-2a cells under two different
clinically reliable insulin-resistant conditions: inflammation and dyslipidemia
2) We found different informatic characteristics between the two insulin-resistant phosphoproteomes
by comparative informatics analysis
4. Informatic analysis of phosphoproteomes of TNF-a -induced insulin-resistant conditions 3) We found commonly changed molecular signatures, including phosphoproteins, in the integrin,
Pyridoxal 5'-phosphate salvage, HIPPO signaling, sumoylation, Cell Cycle, and AMPK pathway
A B C under insulin resistance and verified these targets by subsequent biochemical experiments
4) Among the commonly changed molecular signatures, the phosphorylation of acetyl-CoA
carboxylase(ACC) and Src was also found to be altered in the brains of 5xFAD mice (preliminary)
References & Acknowledgement
1) “Brain insulin resistance in type 2 diabetes and Alzheimer disease: concepts and conundrums” Nat Rev Neurol. 2018 Mar; 14(3): 168–181
2) “The diagnostic value of FDG and amyloid PET in Alzheimer's disease-A systematic review” Eur J Radiol. 2017 Sep;94:16-24
3) “Synaptic energy use and supply” Neuron. 2012 Sep 6;75(5):762-77
D 4) “Is insulin action in the brain clinically relevant?” Diabetes. 2012 Apr; 61(4): 773–775
5) “Mechanisms of Insulin Resistance at the Crossroad of Obesity with Associated Metabolic Abnormalities and Cognitive Dysfunction” Int J Mol Sci. 2021 Jan 7;22(2):546
6) “Proteomic analysis of the palmitate-induced myotube secretome reveals involvement of the annexin A1- FPR2 pathway in insulin resistance” Mol Cell Proteomics.
2015 Apr;14(4):882-92
7) “Proteomic analysis of TNF-α-induced L6 myotube secretome reveals novel TNF-α-dependent myokines in diabetic skeletal muscle” J Proteome Res. 2011 Dec
2;10(12):5315-25
8) “Cell adhesion molecules in Alzheimer's disease” Degener Neurol Neuromuscul Dis. 2012 Jul 4;2:65-77
9) “AMPK: A bridge between diabetes mellitus and Alzheimer's disease” Behav Brain Res. 2021 Feb 26;400:113043
10)“Use of biomarkers in clinical trials of Alzheimer disease: from concept to application” Mol Diagn Ther. 2011 Dec 1;15(6):313-25
11)“Brain Insulin Resistance at the Crossroads of Metabolic and Cognitive Disorders in Humans” Physiol Rev. 2016 Oct;96(4):1169-209
12)“Saturated fatty acid-mediated inflammation and insulin resistance in adipose tissue: mechanisms of action and implications” J Nutr. 2009 Jan;139(1):1-4
13)This research was supported by KBRI basic research program (18-BR-02-08) and by the Korea Research Institute of Bioscience and Biotechnology (KRIBB) Research
Initiative Program (KGM4562121 to YSO)

