


Page 61 - ebook
P. 61
Development of a single-cell Ampli-seq based method for determining the
                stages in cellular differentiation of embryonic stem cell to dopaminergic neuron


   Jooyeon Lee , Seong-Ho Park , Woojeung Song ,Hee-chang Moon,Yohan Oh & Dokyoung Kim & Junho K. Hur *
                                                            3
                                                                          4
                                                                                      3
            1
                                       1
                         1
  1. Department of biomedical science, Graduate School of Biomedical Science & Engineering, Hanyang University, Seoul, Korea
  2. Department of medicine, in medical genetics, Graduate School, Hanyang University, Seoul, Korea
  3. Department of Genetics, College of Medicine, Hanyang University, Seoul, Korea
  4. Department of Anatomy and Neurobiology, College of Medicine, Kyung Hee University
                                                                (A)                   (B)
      Introduction
     Parkinson's disease (PD) is a chronic progressive degenerative
     disease of the nervous system caused by the loss of dopaminergic
     neurons. It is the second-most common neurodegenerative disorder
     that affects 2–3% of the population over 65 years of age. Symptoms
     of Parkinson's disease include kinesia (slow movement), tremors at
     rest, muscle stiffness, and postural instability. While there is no cure  (C)    (D)
     for PD, a clinical study demonstrated a successful treatment of
     Parkinson's disease by delivering dopaminergic neurons that were
     differentiated from induced pluripotent stem cell (iPSc) of a patient [1].
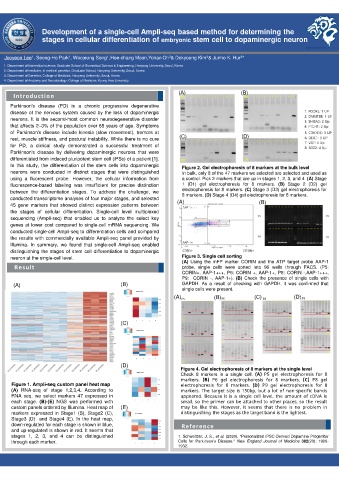
     In this study, the differentiation of the stem cells into dopaminergic  Figure 2. Gel electrophoresis of 8 markers at the bulk level
     neurons were conducted in distinct stages that were distinguished  In bulk, only 8 of the 47 markers we selected are selected and used as
     using a fluorescent probe. However, the cellular information from  a control. Pick 2 markers that are up in stages 1, 2, 3, and 4. (A) Stage
     fluorescence-based labeling was insufficient for precise distinction  1 (D1) gel electrophoresis for 8 markers. (B) Stage 2 (D2) gel
     between the differentiation stages. To address the challenge, we  electrophoresis for 8 markers. (C) Stage 3 (D3) gel electrophoresis for
                                                                 8 markers. (D) Stage 4 (D4) gel electrophoresis for 8 markers.
     conducted transcriptome analyses of four major stages, and selected  (A)
     45 gene markers that showed distinct expression patterns between                       (B)
     the stages of cellular differentiation. Single-cell level multiplexed
     sequencing (Ampli-seq) that enabled us to analyze the select key
     genes at lower cost compared to single-cell mRNA sequencing. We
     conducted single-cell Ampli-seq to differentiation cells and compared
     the results with commercially available Ampli-seq panel provided by
     Illumina. In summary, we found that single-cell Ampli-seq enabled
     distinguishing the stages of stem cell differentiation to dopaminergic
     neuron at the single-cell level.                            Figure 3. Single cell sorting
                                                                 (A) Using the mFP marker CORIN and the ATP target probe AAP-1
      Result                                                     probe, single cells were sorted into 96 wells through FACS. (P5:
                                                                 CORIN+, AAP-1+++, P6: CORIN +, AAP-1+, P8: CORIN -,AAP-1+++,
                                                                 P9: CORIN -, AAP-1+). (B) Check the presence of single cells with
      (A)                                  (B)                   GAPDH. As a result of checking with GAPDH, it was confirmed that
                                                                 single cells were present.
                                                 Log2 CPM heat map (Custom1)
                                                              (A)           (B)           (C)           (D)


                                           (C)   C 1  C 2  C 3  C 4
                                                 Log2 CPM heat map (Custom2)


                                                 C  C  C  C
                                                 1  2  3  4
                                           (D)
                                                                Figure 4. Gel electrophoresis of 8 markers at the single level
                                                                Check 8 markers in a single cell. (A) P5 gel electrophoresis for 8
                                                 Log2 CPM heat map (Custom3)
                                                 Log2 CPM heat map (Custom3)
                                                                markers. (B) P6 gel electrophoresis for 8 markers. (C) P8 gel
     Figure 1. Ampli-seq custom panel heat map                  electrophoresis for 8 markers. (D) P9 gel electrophoresis for 8
     (A) RNA-seq of stage 1,2,3,4. According to                 markers. The target size is 150bp, but a lot of non-specific bands
     RNA seq. we select markers 47 expressed in                 appeared. Because it is a single cell level, the amount of cDNA is
     each stage. (B)-(E) NGS was performed with  C 1  C 2  C 3  C 4  small, so the primer can be attached to other places, so the result
     custom panels ordered by Illumina. Heat map of  (E)        may be like this. However, it seems that there is no problem in
     markers expressed in Stage1 (B), Stage2 (C),  Log2 CPM heat map (Custom4)  distinguishing the stages as the target band is the lightest.
     Stage3 (D) and Stage4 (E). In the heat map,
     down-regulated for each stage is shown in blue,             Reference
     and up-regulated is shown in red. It seems that
     stages 1, 2, 3, and 4 can be distinguished                 1. Schweitzer, J. S., et al. (2020). "Personalized iPSC-Derived Dopamine Progenitor
     through each marker.                       C 1  C 2  C 3  C 4  Cells for Parkinson’s Disease." New England Journal of Medicine 382(20): 1926-
                                                                1932.

