


Page 41 - ebook
P. 41
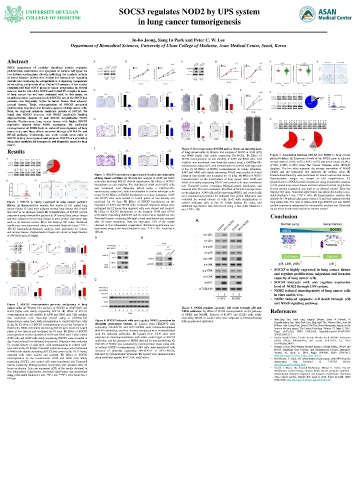
UNIVERSITY OF ULSAN SOCS3 regulates NOD2 by UPS system
COLLEGE OF MEDICINE
in lung cancer tumorigenesis
In-ho Jeong, Sang In Park and Peter C. W. Lee
Department of Biomedical Sciences, University of Ulsan College of Medicine, Asan Medical Center, Seoul, Korea
Abstract
SOCS (suppressor of cytokine signaling) protein regulates
proliferation, maturation and apoptosis of various cell types via
two distinct mechanisms: directly inhibiting the catalytic activity
of Janus Kinases (JAKs) that initiate the intracellular signaling
cascade and catalyzing the ubiquitination of signaling components
by recruiting components of an Cullin5 E3 complex. A few studies
demonstrated that SOCS promote tumor progression in several
cancers, but the role of the SOCS and Cullin5 E3 complex in onset
of lung cancer has not been evaluated well. In this study, we
identified protein expression level of SOCS3, one of the SOCS box
proteins, was frequently higher in tumor tissues than adjacent
normal tissues. Truly, overexpression of SOCS3 promoted
proliferation, migration and invasion capacity of lung cancer cells.
Next, we explored substrate candidate protein of SOCS3. We
found that SOCS3 interacts with NOD2 (nucleotide binding
oligomerization domain 2) and SOCS3 ubiquitinates NOD2
directly. Furthermore, lung cancer tissues with higher SOCS3
expression showed lower NOD2 expression. We confirmed
overexpression of NOD2 leads to reduced tumorigenicity of lung
cancer cells, and these effects occurred through p38 MAPK and
NF-κB pathway. Collectively, our work reveals novel roles of
SOCS3 in lung tumorigenesis and proposes SOCS3 as a promising
biomarker candidate for therapeutic and diagnostic target for lung
cancer.
Results Figure 5. Overexpression of NOD2 and its effects on tumorigenesis
of lung cancer cells. A) Western blot analysis of NOD2 in A549 (left)
and H460 (right) cells stably expressing HA-NOD2. B) Effect of Figure 7. Association between SOCS3 and NOD2 in lung cancer
NOD2 overexpression on cell viability of A549 and H460 cells. Cell patient’s tissue. A) Expression levels of the NOD2 gene in adjacent
viability was monitored over three-day period using a CellTiter-Glo normal tissue (LUAD, n=59; LUSC, n=51) and tumor tissue (LUAD,
luminescence assay (n=5, with normalization to control wild-type cells n=506; LUSC, n=495) from The Cancer Genome Atlas (TCGA)
at day 0). C) Effect of NOD2 overexpression on colony formation. database. The box plots represent the average expression of NOD2
A549 and H460 cells stably expressing NOD2 were seeded in 6-well (±SD) and the horizontal line indicates the median value. B)
Figure 3. SOCS3 knockdown suppress proliferation and migration plates at low density and incubated for 10 days. D) Effect of NOD2 Immunohistochemistry were performed for tumors and normal tissues.
of lung cancer cell lines. A) Western blot analysis of A549 and H460 overexpression on the invasiveness of lung cancer cells. A549 and Representative images are shown at x40 magnification. C)
cells after lentiviral SOCS3 shRNA transfection. B) Effect of SCSO3 H460 cells stably expressing NOD2 and control cells were transferred Quantification of NOD2 protein expression using immunoblot analysis
knockdown on cell viability. The viability of A549 and H1975 cells into Transwell inserts containing Matrigel-coated membranes and in 134 paired lung cancer tissues and their adjacent normal lung tissues.
was monitored over three-day period using a CellTiter-Glo assessed after 20 hours incubation. E) Effect of NOD2 overexpression β-actin protein expression was used as an internal control. Error bar
luminescence assay (n=5, with normalization to control wild-type cells on the migration. A549 cells stably expressing NOD2, and control cells displays SD value. Statistical significance was determined using a two-
at day 0). C) Effect of SOCS3 knockdown on colony formation. A549 were wounded and cultured for indicated time period. Migration was sided Student’s t test, ***P < .001. D) Representative western blot
and H1975 cells were seeded in 6-well plates at low density and evaluated by wound closure of cells (n=5, with normalization to analysis in 134 paired lung cancer tissues (T) and their adjacent normal
Figure 1. SOCS3 is highly expressed in lung cancer patient’s incubated for 10 days. D) Effect of SOCS3 knockdown on the control wild-type cells at day 0). Graph display SD value, and lung tissues (N). The ratio of tissues with high SOCS3 and low NOD2
tissues. A) Representative western blot results in 141 paired lung migration of A549 and H1975 cells. Transwell migration assays were statistical significance was determined using a two-sided Student’s t protein expression determined by immunoblot analysis was illustrated
cancer tissues (T) and their adjacent normal lung tissues (N). β-actin performed for 12 hours, then migrated cells were stained and counted. test, ***P < .001. by pie chart. β-actin was used as an internal control.
was used as an internal control. B) Quantification of SOCS3 protein E) Effect of SOCS3 knockdown on the invasion. A549 and H1975
expression using immunoblot analysis in 141 paired lung cancer tissues cells stably expressing shSOCS3 and sh-control were transferred into Conclusion
and their adjacent normal lung tissues. β-actin protein expression was Transwell inserts containing Matrigel-coated membranes and assessed
used as an internal control. Error bar displays SD value. Statistical after 20 hours incubation. Data are expressed ±SD of the results
significance was determined using a two-sided Student’s t test, ***P < obtained in five independent experiments. Statistical significance was
.001.C) Immunohistochemistry analysis were performed for tumors determined using a two-sided Student’s t test, ***P < .001. Scale bar =
and normal tissues. Representative images are shown at magnification 100 μm
of x40 (left) and x10 (right).
• SOCS3 is highly expressed in lung cancer tissues
and regulate proliferation, migration and invasion
capacity of lung cancer cells.
• SOCS3 interacts with and regulate expression
level of NOD2 through UPS system.
• NOD2 reduced tumorigenicity of lung cancer cells
in vitro and in vivo.
• NOD2 induced apoptotic cell death through p38
Figure 2. SOCS3 overexpression promote malignancy of lung and NFκB signaling pathway.
cancer cells. A) Western blot analysis of SOCS3 in A549 (left) and Figure 6. NOD2 regulate apoptotic cell death through p38 and
H460 (right) cells stably expressing SOCS3. B) Effect of SOCS3 NFkB pathways. A) Effect of NOD2 overexpression on the pathway References
overexpression on cell viability in A549 and H460 cells. Cell viability of NFkB and MAPK. Extracts of H1975 and H3255 cells stably
was monitored over three-day period using a CellTiter-Glo expressing NOD2 or control cells were subjected to immunoblotting • Wan-Ling Tan, Amit Jain, Angela Takano, Evan W Newell, N
luminescence assay (n=5, with normalization to control wild-type cells Figure 4. SOCS3 interacts with and regulate NOD2 expression by with an indicated antibodies. Gopalakrishna Iyer, Wan-Teck Lim, Eng-Huat Tan, Weiwei Zhai, Axel M
at day 0). C) Effect of SOCS3 overexpression on colony formation of ubiquitin proteasome system. A) Lysates from HEK293T cells Hillmer, Wai-Leong Tam, Daniel S W Tan, Novel therapeutic targets on the
H460 cells. H460 cells stably expressing SOCS3 were seeded in 6-well expressing HA-SOCS3 and MYC-NOD2 were immunoprecipitated horizon for lung cancer, The Lancet Oncology, Volume 17, Issue 8, 2016,
plates at low density and incubated for 10 days. D) Effect of SOCS3 with HA antibodies, and then immune complexes were immunoblotted Pages e347-e362, ISSN 1470-2045, https://doi.org/10.1016/S1470-
overexpression on the migration of A549 and H460 cells. Left) Control with the indicated antibodies. B) Lysates from A549 cells were 2045(16)30123-1.
A549 cells and A549 cells stably expressing SOCS3 were wounded at subjected to immunoprecipitation with either control IgG or SOCS3 • Kyoko Inagaki-Ohara, Taisuke Kondo, Minako Ito & Akihiko Yoshimura
day 0 and cultured for indicated time period. Migration was evaluated antibodies, and the presence of NOD2 detected by immunoblotting. C) (2013) SOCS, inflammation, and cancer, JAK-STAT, 2:3, DOI:
by wound closure of cells (n=5, with normalization to control wild- Half-life of NOD2 was evaluated by cycloheximide chase assay with 10.4161/jkst.24053
type cells at day 0). Right) Transwell migration assays were performed or without SOCS3 overexpression. A549 cells were transfected with • Roberta Caruso, Neil Warner, Naohiro Inohara, Gabriel Núñez,, NOD1 and
NOD2: Signaling, Host Defense, and Inflammatory Disease, Immunity,
in H460 cells stably expressing SOCS3 and control cells. At 12 hours, mixtures of plasmids expressing HA-SOCS3 or MYC-NOD2, Volume 41, Issue 6, 2014, Pages 898-908, ISSN 1074-7613,
migrated cells were stained and counted. E) Effect of SOCS3 followed by cycloheximide treatment. The lysates were immunoblotted https://doi.org/10.1016/j.immuni.2014.12.010.
overexpression on the invasiveness. A549 and H460 cells stably using antibodies against MYC, HA, and β-actin. • Ben-Neriah, Y., Karin, M. Inflammation meets cancer, with NF-κB as the
expressing SOCS3, and control cells were transferred into Transwell matchmaker. Nat Immunol 12, 715–723 (2011).
inserts containing Matrigel-coated membranes and assessed after 20 https://doi.org/10.1038/ni.2060
hours incubation. Data are expressed ±SD of the results obtained in • Harald J. Maier, Uta Schmidt-Straßburger, Margit A. Huber, Eva M.
five independent experiments. Statistical significance was determined Wiedemann, Hartmut Beug, Thomas Wirth, NF-κB promotes epithelial–
using a two-sided Student’s t test, **P < .01; ***P < .001. Scale bar = mesenchymal transition, migration and invasion of pancreatic carcinoma
100 μm. cells, Cancer Letters, Volume 295, Issue 2, 2010, Pages 214-228, ISSN
0304-3835, https://doi.org/10.1016/j.canlet.2010.03.003.

