


Page 23 - ebook
P. 23
The mechanism of gap creation by a  multifunctional
                         nuclease during base excision repair


                         Jungmin Yoo and Gwangrog Lee
                         School of Life Sciences, Gwangju Institute of Science and Technology, Gwangju, 61005, Republic of Korea

   ABSTRACT
   During base excision repair, a transient single-stranded DNA (ssDNA) gap is produced at the apurinic/apyrimidinic (AP) site. Exonuclease III, capable of performing both AP endonuclease and
   exonuclease activity, are responsible for gap creation in bacteria. We used single-molecule fluorescence resonance energy transfer to examine the mechanism of gap creation. We found an AP
   site anchor-based mechanism by which the intrinsically distributive enzyme binds strongly to the AP site and becomes a processive enzyme, rapidly creating a gap and an associated transient
   ssDNA loop. The gap size is determined by the rigidity of the ssDNA loop and the duplex stability of the DNA and is limited to a few nucleotides to maintain genomic stability. When the 3′ end is
   released from the AP endonuclease, polymerase I quickly initiates DNA synthesis and fills the gap. Our work provides previously unidentified insights into how a signal of DNA damage changes
   the enzymatic functions.
   INTRODUCTION
   Base damage, the most common DNA lesion, is caused by alkylation, oxidation, deamination, and depurination/depyrimidination 1 . A series of enzymes
   recognize and process various kinds of DNA base damage in sequence in a process called base excision repair (BER). In BER, all damaged bases
   are cleaved and converted into apurinic/apyrimidinic (AP) sites by damage-specific glycosylases. Upon the removal of the damaged bases by
   glycosylases, exonuclease III (ExoIII) precisely cut the phosphodiester backbone of DNA (Fig. 1). ExoIII in Escherichia coli and apurinic/apyrimidinic
   endonuclease I and II (APE1 and APE2) in humans are ExoIII family members and the main AP endonucleases responsible for processing over 80%
   of base damage 2, 3 . ExoIII is a multifunctional enzyme that functions as both an AP endonuclease at AP sites and an exonuclease in the absence of AP  Fig. 1. Structure of ExoIII. Modeled DNA-enzyme complex
   sites 4, 5 . It remains unknown how both enzymatic activities are coordinated during gap creation and how the gap size is limited to a few nucleotides for  reconstituted in silico from ExoIII (PDB entry: 1AKO) and DNA
                                                                                     (PDB entry: 1DE8), showing the active site (green), the binding
   optimal repair. We addressed how the dual function of ExoIII is regulated on different substrates and in different buffer conditions.  of the protruding α helix into the DNA major groove (blue), and
                                                                                     AP site–specific binding (red).
   METHODS                                                                                  Fig. 2. smFRET experimental scheme
                                                                                            before and after degradation by ExoIII and
                                                                                            an ssDNA mimicking the degradation
                                                                                            product (left). ExoIII converts the dsDNA
   To monitor the activity of ExoIII in real time, we adopted single molecule fluorescence resonance  between  the  donor  (green)  and  the
   energy transfer (smFRET) 6 . The donor (Cy3) and acceptor (Cy5) dyes were covalently     acceptor (red) to ssDNA, resulting in an
                                                                                                      efficiency.
                                                                                                   FRET
   connected to the 5’ non-hydrolyzed strand of a double-stranded (ds)DNA (left in Fig. 2). The  increase  in  FRET  time  trajectory A
                                                                                            representative
   dsDNA substrate was immobilized on a quartz surface. When ExoIII with a reaction buffer was  showing how the degradation time is
                                                                                            measured. The total intensity is the sum of
   added to the DNA substrate, the enzyme degraded only the 3' hydrolyzed strand. The       the donor and acceptor intensities (black,
   degradation of the 3' strand leaves 5' single-stranded (ss)DNA, which undergoes ssDNA    top). Green and red curves represent the
   shrinkage and show increased FRET due to decreased distance between Cy3 (green line) and  donor  and  acceptor  intensities,
                                                                                            respectively (middle), and the blue curve
   Cy5 (red line) (right in Fig. 2).                                                        represents the calculated FRET efficiency
                                                                                            (bottom) (right). a.u., arbitrary units.
   RESULTS
    ExoIII processively degrades DNA substrates containing an AP site, whereas it performs  Coordinated gap processing and gap filling by ExoIII
    distributive degradation on dsDNA substrates lacking an AP site.   and pol I.
   A                               A                B                A              B             C
                                   C
   B              C                               D


                                    E
   Fig. 3. Schematics of different substrates(A). (B) Average degradation time per
   nucleotide for various DNA substrates with SEM. Degradation times were  Fig. 5. Coordinated gap processing and gap filling by ExoIII and pol I. (A) Representative fluorescence
   determined during which FRET increases from the minimum to the maximum  intensity (top, green for donor and red for acceptor) and FRET efficiency time trajectories (blue) with the
                                                                      characteristic features of degradation (orange region), polymerase binding (violet region), and
   values. (C) Fraction degraded versus NaCl concentration for the three different
   substrates (AP-DNA, nicked AP-DNA, and nicked DNA), showing a strong ExoIII  polymerization (green region). The experiments were performed by adding ExoIII and pol I to AP-DNA in
   affinity for the AP site even at high NaCl concentrations.         a solution containing Mg2+ and dNTPs. (B) Histograms (top) before (black) and after (gray) degradation.
                                                                      The FRET efficiency shift caused by degradation in the presence of pol I indicates that the gap size is
                                                                      approximately 5 to 6 nt long. Calibration curve of FRET efficiency and gap size measured at various salt
   To investigate the effect of AP sites on enzymatic activity,       concentrations with 10 mM Mg 2+ (bottom). (C) Degradation rate and polymerization rate as a function of
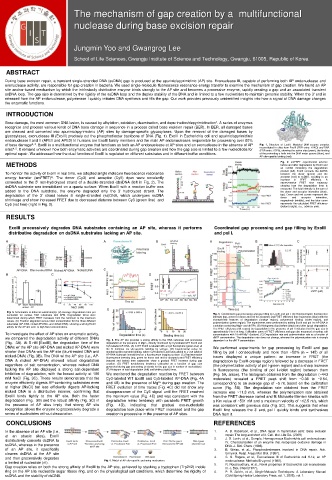
   we compared the degradation activity of different DNAs  Fig. 4. The AP site provides a strong affinity to the DNA substrate and processive  dNTP concentration. The degradation rate does not change, whereas the polymerization rate is strongly
   (Fig. 3A). At 5 nM [ExoIII], the degradation time of the  degradation in the presence of Mg2+, directly monitored by Cy3-labeled WT ExoIII and  dependent on the dNTP concentration.
   DNAs w/ the AP site (AP-DNA and nicked AP-DNA) were  Cy5-labeled AP-DNA. (A) A WT ExoIII is labeled with a Cy3 fluorophore (green star) at  We performed experiments for gap processing by ExoIII and gap
   shorter than DNAs w/o the AP site (blunt-ended DNA and  the N terminus via site-specific labeling by sortase. (B) Experimental setup for  filling by pol I consecutively and more than ~52% (n = 145) of all
                                    monitoring direct protein binding, where Cy3-labeled ExoIII was added to a Cy5-labeled
   nicked-DNA) (Fig. 3B). The DNA w/ the AP site (i.e., AP-  AP-DNA substrate immobilized on a fluorescence imaging surface. (C) Representative  traces displayed a unique pattern: an increase in FRET (the
                                    fluorescence intensity (top, green for donor and red for acceptor) and FRET efficiency
   DNA & nicked AP-DNA) showed robust degradation  (second and below) time trajectories show a gradual FRET increase during gap  degradation by ExoIII-orange region) followed by a decrease in FRET
   regardless of salt concentration, whereas nicked DNA  creation. (D) FRET evolutionary tendency calibrated as a function of gap size  (the polymerization activity of pol I-green region) and a sharp increase
                                    generated during gap processing (x stands for the gap size in number of nucleotides).
   lacking the AP site displayed a strong salt-dependent  (E) Histogram of total degradation (left) and binding (right) times.  in fluorescence (the binding of pol I-violet region) between them
   inhibition of degradation, with the lowest activity at 100  We monitored the degradation reaction by FRET between  (Fig. 5A, arrow). The histogram obtained from the degradation (~443
   mM NaCl (Fig. 3C). These results demonstrate that the  Cy3-labeled WT ExoIII and Cy5-labeled AP-DNA (Fig. 4A  molecules) revealed a FRET peak shift from ~0.36 to ~0.54,
   enzyme efficiently digests AP-containing substrates even  and 4B) in the presence of Mg 2+ during gap creation. The  corresponding to an average gap of ~5 nt, based on the calibration
   at higher [NaCl] but less efficiently digests AP-lacking  FRET evolution of time traces (Fig. 4C) did not show any  curve (Fig. 5B). The degradation rate obtained from the FRET
   nicked DNA in a distributive manner, confirming that  disappearance of the Cy3 signal until the FRET reached  increase was ~11.8 nt/s, whereas the polymerization rate obtained
   ExoIII binds tightly to the AP site. Both the faster  the maximum value (Fig. 4E) and was consistent with the  from the FRET decrease varied and fit Michaelis-Menten kinetics with
   degradation (Fig. 3B) and the robust affinity (Fig. 3C) in  degradation mimic tendency with parabolic FRET growth  a Km value of ~531 nM and a maximum velocity of ~12.5 nt/s, which
   the presence of AP sites imply that strong AP site  (Fig.  4D),  indicating  that  gradual  exo-nucleolytic  was consistent with previous data (Fig. 5C). This suggests that when
   recognition allows the enzyme to processively degrade a  degradation took place while FRET increased and the gap  ExoIII first releases the 3′ end, pol I quickly binds and synthesizes
   series of nucleotides without dissociation.  creation is processive in the presence of AP sites.  DNA from it.
   CONCLUSIONS                                                        REFERENCES
   In the absence of an AP site (i.e.,                                 1.  A. B. Robertson, et al., DNA repair in mammalian cells: Base excision
   at  an  abasic  sites),  ExoIII                                        repair: The long and short of it. Cell. Mol. Life Sci. (2009)
   distributively converts dsDNA to                                    2.  J. D. Levin, et al., Demple, Homogeneous Escherichia coli endonuclease
                                                                          IV. Characterization of an enzyme that recognizes oxidative damage in
   ssDNA, whereas in the presence                                         DNA. J. Biol. Chem. (1988).
   of an AP site, it specifically                                      3.  B. Weiss, et al., Phosphodiesterases involved in DNA repair. Adv.
   cleaves dsDNA at the AP site                                           Enzymol. Relat. Areas Mol. Biol. (1987).
   and then processively degrades                                      4.  S. G. Rogers, et al., Exonuclease III of Escherichia coli K-12, an AP
   a limited of nucleotide (nt).   Fig. 6. Model of AP site–specific anchoring mechanism.   5.  endonuclease. Methods Enzymol. (1980).
                                                                          R. Roychoudhury, et al., Novel properties of Escherichia coli exonuclease
   Gap creation relies on both the strong affinity of ExoIII to the AP site, achieved by stacking a tryptophan (Trp212) indole  III. J. Biol. Chem(1977).
   ring on the AP site nucleotide sugar ribose ring, and on the physiological salt conditions, which determine the rigidity of  6.  P. R. Selvin, et al., Single-Molecule Techniques: A Laboratory Manual
   ssDNA and the stability of dsDNA.                                      (Cold Spring Harbor Laboratory Press, ed. 1, 2008), vol. 1.

