
Page 3 - V. Proteomics
P. 3
Developing Quantitative Detection Method for Posttranslational
Modifications of P53 in Colon Cancer Cell
1
Eda ATES 1,2 , Young Sook Yoo ,Min-Jung Kang 1,2*
1 Molecular Recognition Research Center, Korea Institute of Science and Technology, Hwarang-ro 14-gil 5, Seongbuk-gu, Seoul 136-791, Republic of Korea.
2 Division of Bio-medical science and technology, KIST School, Korea University of Science and technology, Seoul 02792, Republic of Korea.
Abstract Methods and Materials
Separations were carried out using a Beckman Coulter PA 800 ProteomLab equipped with a solid
The tumor suppressor p53 plays a critical role in the response to cellular stress including DNA damage, state laser induced fluorescence detector (λexcitation: 488 nm, λemission: 520nm). The working
hypoxia, oncogene activation and ribosomal stress. The p53 protein, which is transcriptionally modified length of uncoated capillary (i.d. of 50 µm) 38.2 cm in total length and the effective length was 28
by posttranslational modifications (PTMs), regulates hundreds of genes that control cell cycle arrest, ap cm. The capillary was pre-conditioned (using a pressure of 20 psi at the capillary inlet) with water
optosis and senescence. Our study’s aim is to develop a quantitative detection method for PTMs of p53 for 10 min, 1 M NaOH for 10 min, and then BGE for 10 min. The rinsing between two analyses was
in colon cancer cell using capillary electrophoresis coupled with laser-induced fluorescence (CE-LIF). carried out with, 1M NaOH for 5 min, deionized water for 5 min, and finally the running BGE for 5
We developed a quantitative CE-LIF method for the analysis of phosphorylated peptides of p53. We ha min using a pressure of 20 psi. A plug of sample was hydrodynamically injected from the inlet end
ve analyzed 5 different 5-Carboxyfluorescein (5-FAM) labelled p53 peptides which was phosphorylated by applying a pressure of 0.5 psi for 10 s. The separation was carried out under 20 kV at 25°C and
from different parts. Consequently, we have developed a sensitive, reproducible, cost effective and quan the samples were maintained at 4°C with the sample storage module of the PA 800 Plus equipment.
titative method for analysis of PTMs in p53. This methods can be further used in the detection of p53 in Data acquisition and instrument control were carried out using Karat 8.0 software. All experiments
the cancer cells according to the LOD and LOQ values of validation results. described were performed in triplicates. Data are presented as the mean ± SD. Statistical analysis
Table 1. Sequence of each peptide
Results and Discussion
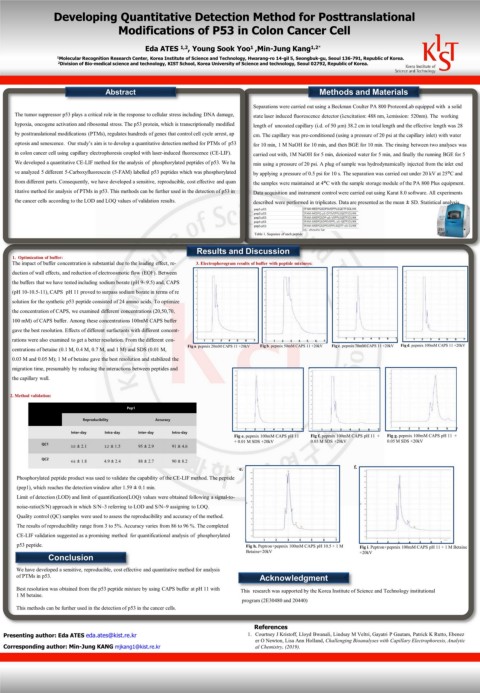
1. Optimization of buffer:
The impact of buffer concentration is substantial due to the loading effect, re- 3. Electropherogram results of buffer with peptide mixtures:
duction of wall effects, and reduction of electroosmotic flow (EOF). Between
the buffers that we have tested including sodium borate (pH 9- 9.5) and, CAPS
(pH 10-10.5-11), CAPS pH 11 proved to surpass sodium borate in terms of re
solution for the synthetic p53 peptide consisted of 24 amino acids. To optimize
the concentration of CAPS, we examined different concentrations (20,50,70,
100 mM) of CAPS buffer. Among these concentrations 100mM CAPS buffer
gave the best resolution. Effects of different surfactants with different concent-
rations were also examined to get a better resolution. From the different con- 1 2 3 4 5 6 7 1 2 3 4 5 6 7 1 2 3 4 5 6 7 1 2 3 4 5 6 7
Fig a. pepmix 20mM CAPS 11 +20kV Fig b. pepmix 50mM CAPS 11 +20kV Fig c. pepmix 70mM CAPS 11 +20kV Fig d. pepmix 100mM CAPS 11 +20kV
centrations of betaine (0.1 M, 0.4 M, 0.7 M, and 1 M) and SDS (0.01 M,
0.03 M and 0.05 M); 1 M of betaine gave the best resolution and stabilized the
migration time, presumably by reducing the interactions between peptides and
the capillary wall.
2. Method validation:
Pep1
Reproducibility Accuracy
1 2 3 4 5 6 7 1 2 3 4 5 6 7 1 2 3 4 5 6 7
Inter-day Intra-day Inter-day Intra-day
Fig e. pepmix 100mM CAPS pH 11 Fig f. pepmix 100mM CAPS pH 11 + Fig g. pepmix 100mM CAPS pH 11 +
+ 0.01 M SDS +20kV 0.03 M SDS +20kV 0.05 M SDS +20kV
QC1
3.0 ± 2.1 3.2 ± 1.5 95 ± 2.9 91 ± 4.6
QC2
4.6 ± 1.8 4.9 ± 2.4 88 ± 2.7 90 ± 8.2
e. f.
Phosphorylated peptide product was used to validate the capability of the CE-LIF method. The peptide
(pep1), which reaches the detection window after 1.59 ± 0.1 min.
Limit of detection (LOD) and limit of quantification(LOQ) values were obtained following a signal-to-
noise-ratio(S/N) approach in which S/N~3 referring to LOD and S/N~9 assigning to LOQ.
Quality control (QC) samples were used to assess the reproducibility and accuracy of the method.
The results of reproducibility range from 3 to 5%. Accuracy varies from 86 to 96 %. The completed
CE-LIF validation suggested as a promising method for quantificational analysis of phosphorylated
1 2 3 4 5 6 7 1 2 5 6
7
4
3
p53 peptide. Fig h. Peptron+pepmix 100mM CAPS pH 10.5 + 1 M Fig i. Peptron+pepmix 100mM CAPS pH 11 + 1 M Betaine
Betaine+20kV +20kV
Conclusion
We have developed a sensitive, reproducible, cost effective and quantitative method for analysis
of PTMs in p53. Acknowledgment
Best resolution was obtained from the p53 peptide mixture by using CAPS buffer at pH 11 with This research was supported by the Korea Institute of Science and Technology institutional
1 M betaine.
program (2E30480 and 20440)
This methods can be further used in the detection of p53 in the cancer cells.
References
Presenting author: Eda ATES eda.ates@kist.re.kr 1. Courtney J Kristoff, Lloyd Bwanali, Lindsay M Veltri, Gayatri P Gautam, Patrick K Rutto, Ebenez
er O Newton, Lisa Ann Holland, Challenging Bioanalyses with Capillary Electrophoresis, Analytic
Corresponding author: Min-Jung KANG mjkang1@kist.re.kr al Chemistry, (2019).