
Page 1 - V. Proteomics
P. 1
Proteomic profiling of CYP11A1 overexpressed kidney cancer cell lines
Hien Thi My Ong¹ ², Min-Jung Kang¹ ² *
,
, ,
¹Molecular Recognition Research Center, Korea Institute of Science and Technology, Hwarangro 14-gil 5, Seongbuk-gu, Seoul 136-791, Republic of Korea
²Division of Bio-Medical Science & Technology, KIST School, Korea University of Science and technology, Seoul 02792, Republic of Korea
ABSTRACT METHODS
Our study focused on the comparison between proteomic profiling of CYP11A1 overexpressed normal and cancer kidney cell
lines. According to the International Agency for Research on Cancer, kidney cancer is the 12th cause of death from cancer 1. Cell lines: 2. Experiment workflow:
worldwide which is currently showed a poor prognosis [1]. CYP11A1 is a mitochondrial side-chain cleavage enzyme catalyze
the initial step in the conversion of cholesterol to pregnenolone. The expression of CYP11A1 was rapidly downregulated in six The HEK293T, A498 and Caki-1 cells were cultured in
cancer types including colon adenocarcinoma, kidney renal clear cell carcinoma, liver hepatocellular carcinoma, lung Dulbecco's modified Eagle's medium (DMEM)
supplemented with 10% fetal bovine serum (FBS), 1%
squamous cell carcinoma, prostate adenocarcinoma and uterine corpus endometrial carcinoma [2]. Our study indicated
overexpression of CYP11A1 can inhibited cancer cells migration and invasion. To explain how CYP11A1 can inhibit cell penicillin/streptomycin (Gibco, USA) and maintained in
a humidified atmosphere of 95% air/5% CO2 at 37˚C.
migration and invasion, we compared proteomic profiling of CYP11A1-transfection and non-transfection in cancer cell lines. A
total of 218 and 161 proteins were identified with high confidence (Score Sequest HT >1, p-value<0.05 and Exp. q-
value<0.005) entries in A498 and Caki-1 respectively. Among these proteins, 78 proteins were overlapped between CYP11A1-
overexpressed and non-transfected kidney cancer cell lines. Ingenuity Pathway Analysis (IPA) showed enrichment of many
cancer-related biological processes and pathways such as EIF2, mTOR, EIF4 and p70S6K signaling. These results
hypothesized that activating steroid biosynthesis may be useful to block cancer progression and targeting of CYP11A1
catalyzes the first step of steroidogenesis as a potential therapeutic target for kidney cancer.
RESULTS
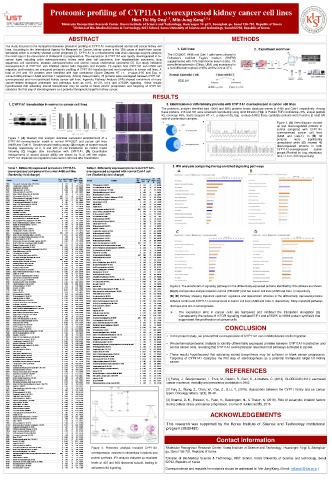
1. CYP11A1 transfection in normal vs cancer cell lines 2. Identification of differentially proteins with CYP11A1 overexpressed in cancer cell lines
D. The proteomic analysis identified total 10048 and 8918 proteins known database entries in A498 and Caki-1 respectively. Among
these proteins, 218 and 161 were screened reproducibly using strict filtration (High in Protein FDR Confidence <5%, unique peptide
≥2, coverage ≥5%, Score Sequest HT >1, p-value<0.05, Exp. q-value<0.005) these candidate proteins were found in at least 6/9
ratio of combination samples.
Figure 2. (A) Veen diagram showed
up and down-regulated proteins in
control compared with CYP11A1
overexpressed cancer cell lines
(A498 and Caki-1). In (B) 33
Figure 1. (A) Western blot analysis indicated successful establishment of a proteins were significantly
CYP11A1-overexpression model in normal HEK293T and cancer cell lines upregulated while (C) showed 45
(A498 and Caki-1). Scratch-wound healing assay (B) Images of scratch-wound down-regulated proteins in both
healing respectively at 0, 5 and 24h of non-transfection as control model CYP11A1-overexpressed cancer
following (C) images after transfection with CYP11A1. (D) Quantitative groups (Ranked by Log 2 abundance
measurement of wound closure ability are shown by % of cell free region, ratio >1.3 or <0.8 respectively)
CYP11A1 impaired cell migration in two cancer cell lines after transfection .
3. IPA analysis comparing the top enriched signaling pathways
Table 1. Differently expressed proteins in CYP11A1- Table 2. Differently expressed proteins in CYP11A1-
overexpressed compared with normal A498 cell line overexpressed compared with normal Caki-1 cell
(Ranked by fold change) line (Ranked by fold change)
Score
Fold
Score
Fold
Accession Description Exp. q- Sum PEP Coverag Sequest Change Accession Description Exp. q- value: Sum PEP Coverage Sequest Change
Score
value
Score
e [%]
[%]
HT
(Log2)
P54886 Delta-1-pyrroline-5-carboxylate synthase GN=ALDH18A1 0 5.95 13 2 5.261272 Combined HT (Log2)
Q99832 T-complex protein 1 subunit eta GN=CCT7 0 6.784 33 2.75 5.172434 P61204 ADP-ribosylation factor 3 GN=ARF3 0 5.39 10 9.9 6.643856
P63313 Thymosin beta-10 GN=TMSB10 0 5.755 75 5.34 4.695012 P31946 14-3-3 protein beta/alpha GN=YWHAB 0 3.219 44 2.17 5.844188
P53675 Clathrin heavy chain 2 GN=CLTCL1 0 26.389 16 11.9 4.693919 O14818 Proteasome subunit alpha type-7 GN=PSMA7 0 4.61 21 2.19 5.841064
P46776 60S ribosomal protein L27a GN=RPL27A 0 6.659 44 10.07 4.679072 O00299 Chloride intracellular channel protein 1 GN=CLIC1 0 9.079 23 4 5.430237
Q14697-2 Isoform 2 of Neutral alpha-glucosidase AB GN=GANAB 0 4.981 8 2.19 4.676416 P61313 60S ribosomal protein L15 GN=RPL15 0 4.574 16 5.8 5.102854
Q9NR31 GTP-binding protein SAR1a GN=SAR1A 0.007 3.22 30 4.4 4.672404 P11413-2 Isoform Long of Glucose-6-phosphate 1-dehydrogenase GN=G6PD 0 10.128 24 4.62 5.093044
P52815 39S ribosomal protein L12, mitochondrial GN=MRPL12 0.007 3.24 23 2.46 4.668715
Q9Y678 Coatomer subunit gamma-1 GN=COPG1 0 7.245 13 6.91 4.66853 P18621-3 Isoform 3 of 60S ribosomal protein L17 GN=RPL17 0.001 2.194 32 2.21 5.09295
Q92945 Far upstream element-binding protein 2 GN=KHSRP 0 4.872 5 4.52 4.665485 P00918 Carbonic anhydrase 2 GN=CA2 0 5.703 20 3.42 5.08336
P60866-2 Isoform 2 of 40S ribosomal protein S20 GN=RPS20 0 11.076 33 4.17 4.662412 Q00341 Vigilin GN=HDLBP 0 3.908 24 1.65 5.078069
P83731 60S ribosomal protein L24 GN=RPL24 0.007 3.226 13 4.18 4.662149 P35232 Prohibitin GN=PHB 0 10.761 28 8.79 5.077817
P39023 60S ribosomal protein L3 GN=RPL3 0 11.336 19 2 3.347555 P47756 F-actin-capping protein subunit beta GN=CAPZB 0.001 2.205 26 1.64 5.077746
P18085 ADP-ribosylation factor 4 GN=ARF4 0 10.35 66 13.56 3.123703
P37837 Transaldolase GN=TALDO1 0 27.272 42 12.65 2.469915 P53621-2 Isoform 2 of Coatomer subunit alpha GN=COPA 0 4.986 14 1.61 5.07692
P46778 60S ribosomal protein L21 GN=RPL21 0 9.2 26 2.26 1.829985 P63220 40S ribosomal protein S21 GN=RPS21 0 3.206 64 3.23 5.075975
P30048 Thioredoxin-dependent peroxide reductase, mitochondrial GN=PRDX3 0 13.508 35 15.75 1.824202 P27348 14-3-3 protein theta GN=YWHAQ 0 5.093 47 2.17 5.075
P49448 Glutamate dehydrogenase 2, mitochondrial GN=GLUD2 0.001 4.037 18 4.33 1.755885 P62249 40S ribosomal protein S16 GN=RPS16 0 6.433 33 7.76 5.074729
Q86VP6 Cullin-associated NEDD8-dissociated protein 1 GN=CAND1 0 14.315 14 7.72 1.713507 P62701 40S ribosomal protein S4, X isoform GN=RPS4X 0 7.299 34 5.26 5.07461
P40925-3 Isoform 3 of Malate dehydrogenase, cytoplasmic GN=MDH1 0 9.893 27 4.55 1.707279 P49327 Fatty acid synthase GN=FASN 0 4.028 6 1.83 5.074072
P45974 Ubiquitin carboxyl-terminal hydrolase 5 GN=USP5 0 6.451 18 3.78 1.693518
P0DP25 Calmodulin-3 GN=CALM3 0 20.086 32 9.35 1.667463 P08708 40S ribosomal protein S17 GN=RPS17 0 4.94 16 8.5 5.072873
P09429 High mobility group protein B1 GN=HMGB1 0 17.922 28 10.89 1.639747 P05556 Integrin beta-1 GN=ITGB1 0 7.014 11 3.97 5.072735
P50990 T-complex protein 1 subunit theta GN=CCT8 0 20.577 29 9.6 1.336773 P40227 T-complex protein 1 subunit zeta GN=CCT6A 0 5.421 19 3.81 5.070089
Q13247 Serine/arginine-rich splicing factor 6 GN=SRSF6 0.007 3.156 10 2.71 1.295462 P61353 60S ribosomal protein L27 GN=RPL27 0 8.722 29 10.15 4.705384
P04075-2 Isoform 2 of Fructose-bisphosphate aldolase A GN=ALDOA 0 33.715 48 17.34 1.264637 P39019 40S ribosomal protein S19 GN=RPS19 0 4.638 21 4.95 4.689886
P63000-2 Isoform B of Ras-related C3 botulinum toxin substrate 1 GN=RAC1 0 4.258 33 5.92 1.257614
P62424 60S ribosomal protein L7a GN=RPL7A 0 16.668 38 6.11 1.22993 P62913 60S ribosomal protein L11 GN=RPL11 0 3.423 13 8.04 4.687103
P42224 Signal transducer and activator of transcription 1-alpha/beta GN=STAT1 0 16.547 18 7.97 1.202183 P25398 40S ribosomal protein S12 GN=RPS12 0 5.06 33 6.64 4.686045
Q09666 Neuroblast differentiation-associated protein AHNAK GN=AHNAK 0 32.821 18 12.35 1.192194 P51148-2 Isoform 2 of Ras-related protein Rab-5C GN=RAB5C 0.001 2.532 10 3.84 4.68519
P78417 Glutathione S-transferase omega-1 GN=GSTO1 0.007 3.177 37 7.32 1.189746 Q13200 26S proteasome non-ATPase regulatory subunit 2 GN=PSMD2 0 3.947 12 1.61 4.683437
P49411 Elongation factor Tu, mitochondrial GN=TUFM 0 12.914 19 11.82 1.187908 O43390-2 Isoform 2 of Heterogeneous nuclear ribonucleoprotein R GN=HNRNPR 0 3.615 7 1.6 4.682468
Q14195-2 Isoform LCRMP-4 of Dihydropyrimidinase-related protein 3 GN=DPYSL3 0 18.459 30 12.88 1.185021
P07237 Protein disulfide-isomerase GN=P4HB 0 41.695 42 35.12 1.174548 P61026 Ras-related protein Rab-10 GN=RAB10 0 5.518 36 1.73 4.682068
P27348 14-3-3 protein theta GN=YWHAQ 0 28.815 63 25.16 1.159127 P31949 Protein S100-A11 GN=S100A11 0 5.357 68 1.76 4.681084
P26641-2 Isoform 2 of Elongation factor 1-gamma GN=EEF1G 0 13.603 36 7.33 1.153373 P61019 Ras-related protein Rab-2A GN=RAB2A 0.002 2.602 23 2.35 4.680507
P25705 ATP synthase subunit alpha, mitochondrial GN=ATP5F1A 0 20.127 25 15.33 1.147234 O75347 Tubulin-specific chaperone A GN=TBCA 0 3.898 27 11.13 4.676951
P63220 40S ribosomal protein S21 GN=RPS21 0.007 3.281 42 1.87 1.1468 Q9Y490 Talin-1 GN=TLN1 0 7.576 12 2.31 4.67535
P11142 Heat shock cognate 71 kDa protein GN=HSPA8 0 100.152 40 91.97 1.13641 P26641-2 Isoform 2 of Elongation factor 1-gamma GN=EEF1G 0 9.265 31 3.74 4.675329
P12004 Proliferating cell nuclear antigen GN=PCNA 0 21.005 18 14.43 1.110215
Q15907 Ras-related protein Rab-11B GN=RAB11B 0 5.513 23 2.63 1.097161 P05388 60S acidic ribosomal protein P0 GN=RPLP0 0 3.406 11 3.68 4.675096
P13489 Ribonuclease inhibitor GN=RNH1 0 25.812 28 12.5 1.083232 P50395 Rab GDP dissociation inhibitor beta GN=GDI2 0 9.868 24 2.02 4.674312
P0DMV9 Heat shock 70 kDa protein 1B GN=HSPA1B 0 49.362 31 37.31 1.065496 Q07960 Rho GTPase-activating protein 1 GN=ARHGAP1 0 4.797 18 1.76 4.673662
P22392-2 Isoform 3 of Nucleoside diphosphate kinase B GN=NME2 0 29.364 76 36.93 1.043189 P61160 Actin-related protein 2 GN=ACTR2 0 3.738 18 1.7 4.67227
Q9UHD8 Septin-9 GN=SEPTIN9 0 6.462 19 6.61 1.039138 P62277 40S ribosomal protein S13 GN=RPS13 0 6.596 38 6.58 4.665286
P12956 X-ray repair cross-complementing protein 6 GN=XRCC6 0 21.138 32 9.36 1.038202
Q96AG4 Leucine-rich repeat-containing protein 59 GN=LRRC59 0 13.444 31 10.11 1.035389 Q13247 Serine/arginine-rich splicing factor 6 GN=SRSF6 0 4.554 10 6.27 4.660588
P05388 60S acidic ribosomal protein P0 GN=RPLP0 0 16.069 22 9.66 1.012529 P42224 Signal transducer and activator of transcription 1-alpha/beta GN=STAT1 0 26.259 37 12.8 3.195033
P08238 Heat shock protein HSP 90-beta GN=HSP90AB1 0 71.977 38 44.86 1.012052 P63104 14-3-3 protein zeta/delta GN=YWHAZ 0 16.884 40 9.44 1.87578
P07195 L-lactate dehydrogenase B chain GN=LDHB 0 33.086 37 40.88 1.010143 O43707 Alpha-actinin-4 GN=ACTN4 0 7.047 23 2.04 1.852348
P62913 60S ribosomal protein L11 GN=RPL11 0 11.64 31 11.18 1.009904 P26038 Moesin GN=MSN 0 18.01 40 8.28 1.839646 Figure 3. The enrichment of signaling pathways in the differentially expressed proteins identified by IPA software are shown.
P08758 Annexin A5 GN=ANXA5 0 37.713 44 36.83 1.00879 P22392-2 Isoform 3 of Nucleoside diphosphate kinase B GN=NME2 0 13.921 42 19.68 1.748414
P21333 Filamin-A GN=FLNA 0 106.342 27 56.83 1.007275 (A) (C) Comparative analysis between normal (HEK293T) and two cancer cell lines (A498 and Caki-1) respectively.
P27797 Calreticulin GN=CALR 0 20.426 28 7.43 1.000961 P21796 Voltage-dependent anion-selective channel protein 1 GN=VDAC1 0 5.994 29 5.97 1.721251
P61204 ADP-ribosylation factor 3 GN=ARF3 0 10.72 41 10.94 0.978521 P07237 Protein disulfide-isomerase GN=P4HB 0 27.214 60 17.65 1.638769
P62277 40S ribosomal protein S13 GN=RPS13 0 11.421 26 13.77 0.964378 P51149 Ras-related protein Rab-7a GN=RAB7A 0 4.084 20 1.88 1.468612 (B) (D) Pathway showing important upstream regulators and downstream effectors in the differentially expressed proteins
P68371 Tubulin beta-4B chain GN=TUBB4B 0 77.376 53 61.35 0.948767 P49411 Elongation factor Tu, mitochondrial GN=TUFM 0 3.811 17 5.6 1.42313
P60842 Eukaryotic initiation factor 4A-I GN=EIF4A1 0 44.442 43 30.99 0.92279 P00338-3 Isoform 3 of L-lactate dehydrogenase A chain GN=LDHA 0 22.837 44 32.93 1.413353 between control and CYP11A1-overexpressed in cancer cell lines (A498 and Caki-1) respectively. Many important pathways
P11021 Endoplasmic reticulum chaperone BiP GN=HSPA5 0 64.9 47 48.36 0.91533
Q06830 Peroxiredoxin-1 GN=PRDX1 0 31.727 50 38.63 0.915075 Q96AG4 Leucine-rich repeat-containing protein 59 GN=LRRC59 0 4.04 16 1.75 1.271094 that have vital role in tumorigenesis.
P21980 Protein-glutamine gamma-glutamyltransferase 2 GN=TGM2 0 16.707 18 3.47 0.897972 P62424 60S ribosomal protein L7a GN=RPL7A 0 4.797 31 1.88 1.20928
P63241-2 Isoform 2 of Eukaryotic translation initiation factor 5A-1 GN=EIF5A 0 24.569 52 25.27 0.878398 P08670 Vimentin GN=VIM 0 14.82 45 2.35 1.168927
P05387 60S acidic ribosomal protein P2 GN=RPLP2 0 10.401 53 9.23 0.81074 P07339 Cathepsin D GN=CTSD 0 6.111 28 8.95 1.144627 The expression eIFs in cancer cells are hampered and inhibited the translation elongation [3].
P06744-2 Isoform 2 of Glucose-6-phosphate isomerase GN=GPI 0 19.73 27 19.95 0.810296 Q71U36 Tubulin alpha-1A chain GN=TUBA1A 0 16.252 61 16.09 1.139979
Q14204 Cytoplasmic dynein 1 heavy chain 1 GN=DYNC1H1 0 41.405 13 21.92 0.732149 P14618 Pyruvate kinase PKM GN=PKM 0 41.138 71 35.79 1.13371 Consequently the reduce of mTOR signaling-mediated EIF4 and p70S6K to inhibit protein synthesis that
P27824-2 Isoform 2 of Calnexin GN=CANX 0 4.673 20 1.88 0.732149 Q92945 Far upstream element-binding protein 2 GN=KHSRP 0.001 2.456 10 4.21 1.13371
P18621-3 Isoform 3 of 60S ribosomal protein L17 GN=RPL17 0 8.945 18 6.53 0.727412 suppressed the proliferation of cancer cells.
P61604 10 kDa heat shock protein, mitochondrial GN=HSPE1 0 15.778 61 12.85 0.71643 P07195 L-lactate dehydrogenase B chain GN=LDHB 0 16.5 31 24.4 1.111106
P14618 Pyruvate kinase PKM GN=PKM 0 103.533 62 81.57 0.681674 Q14697-2 Isoform 2 of Neutral alpha-glucosidase AB GN=GANAB 0 8.549 16 9.91 1.081643
P62906 60S ribosomal protein L10a GN=RPL10A 0 18.566 41 8.17 0.673154 P04406 Glyceraldehyde-3-phosphate dehydrogenase GN=GAPDH 0 14.47 56 1.9 1.074505
P05141 ADP/ATP translocase 2 GN=SLC25A5 0 5.525 19 4.23 0.653824 Q06830 Peroxiredoxin-1 GN=PRDX1 0 21.444 55 23.24 1.0572 CONCLUSION
P62249 40S ribosomal protein S16 GN=RPS16 0 11.357 36 18.15 0.648005 P18085 ADP-ribosylation factor 4 GN=ARF4 0 5.275 21 12.08 1.004242
Q7KZF4 Staphylococcal nuclease domain-containing protein 1 GN=SND1 0 21.143 20 13.86 0.619648
P50395 Rab GDP dissociation inhibitor beta GN=GDI2 0 14.916 36 11.2 0.590243 P63244 Receptor of activated protein C kinase 1 GN=RACK1 0 6.612 30 1.7 1.000881
Q9H9B4 Sideroflexin-1 GN=SFXN1 0 6.335 36 2.87 0.559301 P63241-2 Isoform 2 of Eukaryotic translation initiation factor 5A-1 GN=EIF5A 0 6.331 29 4.25 0.983718 • In the present study, we proved that overexpression of CYP11A1 can inhibited cancer cells migration.
P00338-3 Isoform 3 of L-lactate dehydrogenase A chain GN=LDHA 0 28.296 54 28.69 0.531069 P15121 Aldo-keto reductase family 1 member B1 GN=AKR1B1 0 9.377 28 23.14 0.968808
P62937 Peptidyl-prolyl cis-trans isomerase A GN=PPIA 0 41.365 82 34.53 0.529405 P62937 Peptidyl-prolyl cis-trans isomerase A GN=PPIA 0 8.874 33 5.69 0.949182
P78371 T-complex protein 1 subunit beta GN=CCT2 0 20.493 32 12.06 0.524955
P34932 Heat shock 70 kDa protein 4 GN=HSPA4 0 27.083 36 15.48 0.516688 P05387 60S acidic ribosomal protein P2 GN=RPLP2 0 4.292 24 2.28 0.930884 • We performed proteomic analysis to identify differentially expressed proteins between CYP11A1-transfection and
P15121 Aldo-keto reductase family 1 member B1 GN=AKR1B1 0 26.245 56 31.69 0.504536 P39656 Dolichyl-diphosphooligosaccharide--protein glycosyltransferase 48 kDa subunit GN=DDOST 0 4.643 8 5.19 0.908429
O43707 Alpha-actinin-4 GN=ACTN4 0 64.706 39 40.99 0.491483 Q9NR31 GTP-binding protein SAR1a GN=SAR1A 0 3.489 12 3.57 0.872894 control cancer cells, revealing that CYP11A1 overexpression reversed most pathways activated in cancer.
P61353 60S ribosomal protein L27 GN=RPL27 0 6.907 31 14.92 0.476353 P68104 Elongation factor 1-alpha 1 GN=EEF1A1 0 19.125 24 17.56 0.857583
Q9Y490 Talin-1 GN=TLN1 0 59.42 24 37.56 0.471968 P68371 Tubulin beta-4B chain GN=TUBB4B 0 20.714 44 10.64 0.825921
O75390 Citrate synthase, mitochondrial GN=CS 0 7.044 11 2.14 0.466627 P04075-2 Isoform 2 of Fructose-bisphosphate aldolase A GN=ALDOA 0 11.387 20 4.27 0.745692 • These results hypothesized that activating steroid biosynthesis may be sufficient to block cancer progression.
O75347 Tubulin-specific chaperone A GN=TBCA 0 16.37 44 12.26 0.446197 P11142 Heat shock cognate 71 kDa protein GN=HSPA8 0 37.759 26 39.57 0.585497
P51149 Ras-related protein Rab-7a GN=RAB7A 0 14.834 43 15.65 0.436873 Targeting of CYP11A1 catalyzes the first step of steroidogenesis as a potential therapeutic target for kidney
P18669 Phosphoglycerate mutase 1 GN=PGAM1 0 29.523 39 11.17 0.422711 P08238 Heat shock protein HSP 90-beta GN=HSP90AB1 0 26.778 36 12.37 0.504762
P04406 Glyceraldehyde-3-phosphate dehydrogenase GN=GAPDH 0 37.798 72 20.1 0.41708 P11021 Endoplasmic reticulum chaperone BiP GN=HSPA5 0 22.354 28 13.55 0.451013 cancer.
P40227 T-complex protein 1 subunit zeta GN=CCT6A 0 13.855 46 13.05 0.402722 P30048 Thioredoxin-dependent peroxide reductase, mitochondrial GN=PRDX3 0 7.066 16 3.39 0.306975
P08670 Vimentin GN=VIM 0 19.013 41 10.37 0.381591 P60842 Eukaryotic initiation factor 4A-I GN=EIF4A1 0 12.507 39 3.82 0.284119
P05023 Sodium/potassium-transporting ATPase subunit alpha-1 GN=ATP1A1 0 12.312 16 7.67 0.374189 P25705 ATP synthase subunit alpha, mitochondrial GN=ATP5F1A 0 11.976 37 11.23 0.137066
P61019 Ras-related protein Rab-2A GN=RAB2A 0 18.998 40 13.08 0.363015 REFERENCES
Q9UL46 Proteasome activator complex subunit 2 GN=PSME2 0 15.022 37 7.61 0.337489 P21333 Filamin-A GN=FLNA 0 14.703 13 3.83 -0.11178
Q07065 Cytoskeleton-associated protein 4 GN=CKAP4 0 40.219 34 23.25 0.337362 Q09666 Neuroblast differentiation-associated protein AHNAK GN=AHNAK 0 12.108 26 5.66 -0.48063
P68104 Elongation factor 1-alpha 1 GN=EEF1A1 0 33.633 46 19.59 0.306327 P54886 Delta-1-pyrroline-5-carboxylate synthase GN=ALDH18A1 0 4.358 10 3.39 -0.51251
O00299 Chloride intracellular channel protein 1 GN=CLIC1 0 9.068 43 7.82 0.292913 P27797 Calreticulin GN=CALR 0 16.376 25 8.77 -0.51297 [1] Ferlay, J., Soerjomataram, I., Ervik, M., Dikshit, R., Eser, S., & Mathers, C. (2013). GLOBOCAN 2012: estimated
P30050 60S ribosomal protein L12 GN=RPL12 0 28.051 53 14.72 0.28675 P08758 Annexin A5 GN=ANXA5 0 14.76 39 16.07 -0.58617
P78527 DNA-dependent protein kinase catalytic subunit GN=PRKDC 0 29.375 16 18.35 0.262634 P78527 DNA-dependent protein kinase catalytic subunit GN=PRKDC 0 8.193 13 5.34 -0.70709 cancer incidence, mortality and prevalence worldwide in 2012.
Q04637-9 Isoform 9 of Eukaryotic translation initiation factor 4 gamma 1 GN=EIF4G1 0 16.682 15 5.96 0.257765
P05556 Integrin beta-1 GN=ITGB1 0 13.552 14 12.89 0.240552
P21796 Voltage-dependent anion-selective channel protein 1 GN=VDAC1 0 7.513 19 8.54 0.172914 [2] Fan, Z., Wang, Z., Chen, W., Cao, Z., & Li, Y. (2016). Association between the CYP11 family and six cancer
P20073 Annexin A7 GN=ANXA7 0 6.429 6 11.32 0.16964
P61313 60S ribosomal protein L15 GN=RPL15 0 7.114 38 9.27 0.157475 types. Oncology letters, 12(1), 35-40.
Q15185 Prostaglandin E synthase 3 GN=PTGES3 0 9.462 24 9.19 0.157044
Q71U36 Tubulin alpha-1A chain GN=TUBA1A 0 70.228 52 62.87 0.156612
P08708 40S ribosomal protein S17 GN=RPS17 0 12.738 26 10.48 0.132979
O14818 Proteasome subunit alpha type-7 GN=PSMA7 0 5.353 15 2.8 0.117104 [3] Sharma, D. K., Bressler, K., Patel, H., Balasingam, N., & Thakor, N. (2016). Role of eukaryotic initiation factors
P49327 Fatty acid synthase GN=FASN 0 58.163 19 30.36 0.096412 during cellular stress and cancer progression. Journal of nucleic acids, 2016.
P31949 Protein S100-A11 GN=S100A11 0 6.323 50 6.11 0.067792
Q14974 Importin subunit beta-1 GN=KPNB1 0 29.688 20 15.5 0.061661
Q02878 60S ribosomal protein L6 GN=RPL6 0 17.522 36 4.94 0.022585
P63104 14-3-3 protein zeta/delta GN=YWHAZ 0 58.689 67 43.18 0.019109
P47756 F-actin-capping protein subunit beta GN=CAPZB 0 5.897 28 4.19 -0.00401
P35232 Prohibitin GN=PHB 0 19.438 47 18.5 -0.05423 ACKNOWLEDGEMENTS
P63244 Receptor of activated protein C kinase 1 GN=RACK1 0 23.599 38 20.32 -0.0908
P55786 Puromycin-sensitive aminopeptidase GN=NPEPPS 0 9.469 21 7.66 -0.09097
P23528 Cofilin-1 GN=CFL1 0 11.236 68 12.47 -0.09132
P25398 40S ribosomal protein S12 GN=RPS12 0 12.403 49 12.2 -0.15664 This research was supported by the Korea Institute of Science and Technology institutional
P11413-2 Isoform Long of Glucose-6-phosphate 1-dehydrogenase GN=G6PD 0 43.977 32 40.43 -0.16094
O75340 Programmed cell death protein 6 GN=PDCD6 0 4.917 37 2.42 -0.16524 program (2E30480).
P60953 Cell division control protein 42 homolog GN=CDC42 0 4.277 20 1.96 -0.18771
P53621-2 Isoform 2 of Coatomer subunit alpha GN=COPA 0 11.202 15 6.92 -0.21647
P62701 40S ribosomal protein S4, X isoform GN=RPS4X 0 12.6 35 14.02 -0.25719
P30044 Peroxiredoxin-5, mitochondrial GN=PRDX5 0 4.339 53 4.26 -0.32313
P26038 Moesin GN=MSN 0 29.498 40 32.6 -0.33259
P55209 Nucleosome assembly protein 1-like 1 GN=NAP1L1 0 13.311 23 4.21 -0.34272 Contact information
P04083 Annexin A1 GN=ANXA1 0 112.945 75 83.27 -0.3894
P07339 Cathepsin D GN=CTSD 0 10.639 28 13.34 -0.50795
P39019 40S ribosomal protein S19 GN=RPS19 0 9.423 33 6.36 -0.53185
P34897 Serine hydroxymethyltransferase, mitochondrial GN=SHMT2 0 11.885 17 7.98 -0.56159 Figure 4. Proteomic analysis revealed CYP11A1 ¹Molecular Recognition Research Center, Korea Institute of Science and Technology, Hwarangro 14-gil 5, Seongbuk-
P51148-2 Isoform 2 of Ras-related protein Rab-5C GN=RAB5C 0 5.633 19 4.49 -0.61239
Q07960 Rho GTPase-activating protein 1 GN=ARHGAP1 0 7.275 30 8.55 -0.66989 overexpression involved in intracellular functions and gu, Seoul 136-791, Republic of Korea
P39656 Dolichyl-diphosphooligosaccharide--protein glycosyltransferase 48 kDa subunit GN=DDOST 0.007 3.177 12 2.88 -0.71628
Q00341 Vigilin GN=HDLBP 0 4.746 9 1.74 -0.7442
P00918 Carbonic anhydrase 2 GN=CA2 0 4.107 13 1.9 -0.78505 protein synthesis. IPA analysis indicated up-regulated ²Division of Bio-Medical Science & Technology, KIST School, Korea University of Science and technology, Seoul
P31150 Rab GDP dissociation inhibitor alpha GN=GDI1 0 5.844 29 4.94 -0.81971
Q13200 26S proteasome non-ATPase regulatory subunit 2 GN=PSMD2 0 7.95 11 4.17 -0.85494 levels of 40S and 60S ribosomal subunit, leading to 02792, Republic of Korea
P61026 Ras-related protein Rab-10 GN=RAB10 0 16.62 26 17.54 -0.93328
P31946 14-3-3 protein beta/alpha GN=YWHAB 0 17.545 31 14.27 -1.14206
P61160 Actin-related protein 2 GN=ACTR2 0 4.378 28 2.29 -2.13844 activated EIF2 signaling. Correspondence and requests for materials should be addressed to Min-Jung Kang. (Email: mjkang1@kist.re.kr )