
Page 15 - S. Plant biology
P. 15
Regulation of Stomatal Development by
Stomatal Lineage miRNAs
1
2
Jiali Zhu , Ji-Hwan Park , Seulbee Lee , Jae Ho Lee , Daehee Hwang , June M. Kwak * and Yun Ju Kim *
2,3
2
1,2
1
2
1 Department of New Biology, DGIST, Daegu 42988, Republic of Korea
2 Center for Plant Aging Research, Institute for Basic Science, Daegu 42988, Republic of Korea
3 School of Biological Science, Seoul National University, Seoul 08826, Republic of Korea
*Correspondence: yjkim77@ibs.re.kr; jkwak@dgist.ac.kr
Abstract 3. Validation of Developmental Stage-Specific miRNAs
A
B
ML1 SPCH EPF2 MUTE EPF1 FAMA
ML1 SPCH EPF2 MUTE EPF1 FAMA
miR165a-3P miR167c-3P
Stomata are tiny pores on the plant epidermis where gas exchange occurs between the
plant and the atmosphere. Because of its physiological function, stomatal development proMIR165a::GFP MC GMC proMIR167c::GFP MC GMC
-GUS
-GUS
is tightly linked to the plant development program and global climate changes. During
stomatal development, a protodermal cell undergoes asymmetric division to generate a young young
larger cell and a smaller cell whose fate is to become a pavement cell and a GC GC GC GC
meristemoid cell (MMC), respectively. The MMC undergoes another asymmetric
divisions and differentiates into a guard mother cell (GMC), which finally becomes a
pair of mature guard cells (GC). The positive and negative regulation of the stomatal Row Z-Score Row Z-Score
lineage development governing its initiation, amplification, and differentiation has been Fig. 6 The expression patterns of DE miRNAs in stomatal lineage. Heatmaps show the
expression miR165a-3p (A) and miR167c-3p (B) in each of the stomatal lineage cells. Confocal
well established. However, whether and how miRNA regulates stomatal development is images of proMIR165a:GFP-GUS (A) and proMIR167c:GFP-GUS (B) epidermis. Arrows indicate
largely unknown. Here, we report miRNA profiling of stomatal lineage cells to identify
cells at each stage of stomatal lineage progression. MC, meristemoid cell; GMC, guard mother cell;
miRNAs and their targets modulating stomatal development. We provide genetic GC, guard cell. Scale bars, 20 μm.
evidence that developmental stage-specific miRNAs play a crucial role in stomatal 4. Developmental Stage-Specific miRNAs Regulate Stomatal Development
development. Overall, our results demonstrate that stomatal development is temporally A C
modulated by both epigenetic and genetic mechanisms. ML1 SPCH EPF2 MUTE EPF1 FAMA B ML1 SPCH EPF2 MUTE EPF1 FAMA ML1 SPCH EPF2 MUTE EPF1 FAMA
miR829-5P miR3932b-3P miR861-5P
miR3932a miR861-3P
Introduction WT pro35S::MIR829 WT pro35S:: miR3932b-5P WT STTM-miR861
MIR3932a
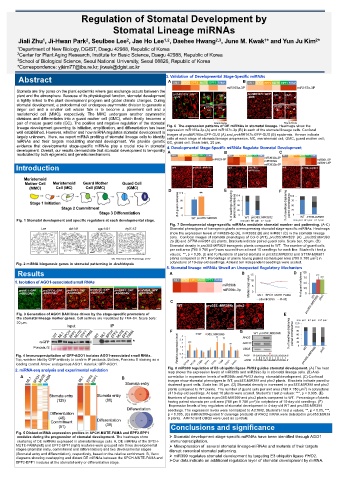
Meristemoid
Mother Cell Meristemoid Guard Mother Guard Cell
(MMC) Cell (MC) Cell (GMC) (GMC)
D 12 0 ** E 10 0 F 10 0
Stage 1 Initiation # of guard cells/area 80 75 50 % of seedlings displaying paired stomata/area 75 50
Stage 2 Commitment 40 % of seedlings displaying paired stomata/area 25 25
Stage 3 Differentiation 0 0 0
WT pro35S::MIR3932
WT STTM-miR861
Fig. 1 Stomatal development and specific regulators at each developmental stage. WT pro35S::MIR829 no pa ir a 1 pair > 1 p air no pa ir 1 pair >1 p air
Fig. 7 Developmental stage-specific miRNAs modulate stomatal number and patterning. (A-C)
Ler dcl1-9 ago1-51 hyl1-12 Stomatal phenotypes of transgenic plants overexpressing stomatal stage-specific miRNAs. Heatmaps
show the expression levels of miR829-5p (A), miR3932 (B) and miR861 (C) in the stomatal lineage
cells. Confocal images of stomatal phenotypes of Col-0 (WT), pro35S:MIR829 (A) , pro35S:MIR393
2a (B) and STTM-miR861 (C) plants. Brackets indicate paired guard cells. Scale bar, 50 μm. (D)
Stomatal density in pro35S:MIR829 transgenic plants compared to WT. The number of guard cells
per unit area (780 X 780 μm 2 ) was scored from at least 10 seedlings for each line. Student’s t test p
values; **, p < 0.05. (E and F) Numbers of paired stomata in pro35S:MIR2932 and STTM-MIR861
2
Gil, Plant and Cell Physiology, 2012 plants compared to WT. Percentage of plants having paired stomata per area (780 X 780 μm ) in
Fig. 2 miRNA biogenesis genes in stomatal patterning in Arabidopsis . cotyledons of 10-day-old seedlings. At least ten independent seedlings were scored.
5. Stomatal lineage miRNAs Unveil an Unexpected Regulatory Mechanism
Results A B 15 D 100 ***
ML1 SPCH EPF2 MUTE EPF1 FAMA 10 75 ***
1. Isolation of AGO1-associated small RNAs 50
miR399b Median log2 value 5 # of guard cells/area
proML1::GFP proSPCH::GFP proEPF2::GFP proMUTE::GFP proEPF1::GFP proFAMA::GFP miR399c-3p 0 25
-AGO1DAH -AGO1DAH -AGO1DAH -AGO1DAH -AGO1DAH -AGO1DAH ML1 SPCH MUTE FAMA 0 WT
C ath-miR399b PHO2 pho2
WT pro35S::MIR399b pho2 pro35S::MIR399b
Fig. 3 Generation of AGO1 DAH lines driven by the stage-specific promoters of E
the stomatal lineage marker genes. Cell outlines are visualized by FM4-64. Scale bars: no pa ir 1 pair ≥2 pair
20 μm. 12 0
Input IP 10 0
G
WT pro35S::MIR399b
WT ML1 SPCH EPF2 MUTE EPF1 FAMA WT ML1 SPCH EPF2 MUTE EPF1 FAMA F 3 WT 35S::MIR399b ** % of seedlings displaying paired stomata/area 80 60 40
PHO2
**
α-GFP * 2. 5 2 *** ** 20
ARF10
Ponceau S Relative expression level 1. 5 1 UBQ5 0 WT pho2
Fig. 4 Immunoprecipitation of GFP-AGO1 isolates AGO1-associated small RNAs. 0. 5 pro35S::MIR399b
Top, western blot by GFP antibody to confirm IP products. Bottom, Ponceau S staining as a 0 TMM
loading control. Arrow: endogenous AGO1. Asterisk: GFP-AGO1. SPCH MUTE FAMA EPF1 EPF2 SDD1 BASL
2. miRNA-seq analysis and experimental validation Fig. 8 miR399 regulation of E3 ubiquitin ligase PHO2 guides stomatal development. (A) The heat
map shows the expression levels of miR399b and miR399c-3p in stomatal lineage cells. (B) Anti-
A B correlation in expression levels of miR399b and PHO2 during stomatal development. (C) Confocal
ML1 SPCH MUTE FAMA ML1 EPF2 EPF1 Stomata entry images show stomatal phenotypes in WT, pro35S:MIR399 and pho2 plants. Brackets indicate pared or
clustered guard cells. Scale bar: 50 μm. (D) Stomatal density is increased in pro35S:MIR399 and pho2
plants compared to WT plants. The number of guard cells per unit area (780 X 780 μm ) in cotyledons
2
of 10-day-old seedlings. At least 10 plants were scored. Student’s t test p values: ***, p < 0.005. (E)
Stomata entry Stomata entry Numbers of paired stomata in pro35S:MIR399 and pho2 plants compared to WT. Percentage of plants
(125) (80) having paired stomata per unit area (780 μm X 780 μm 2 ) in cotyledons of 10-day-old seedlings. (F)
Expression levels of key regulators of stomatal development in 4-day-old WT and pro35S:MIR399
Differentiation seedlings. The expression levels were normalized to ACTIN2. Student’s t test p values; **, p < 0.05, ***,
Differentiation p < 0.005. (G) miRNA399-guided 5’ cleavage products of PHO2 mRNA were detected in pro35S:MIR39
(40) Differentiation 9 plants. ARF10 and UBQ5 were used as controls.
Commitment (39)
(51) Conclusions and significance
Fig. 5 Distant miRNA expression profiles in SPCH-MUTE-FAMA and EPF2-EPF1
modules during the progression of stomatal development. The heatmaps show Ø Stomatal development stage-specific miRNAs have been identified through AGO1
clustering of DE miRNAs expressed in stomatal lineage cells. A, DE miRNAs of the SPCH- immunoprecipitation.
MUTE-FAMA(left) and EPF2-EPF1(right) modules were grouped into three developmental Ø Misexpression of several stomatal lineage-miRNAs and mutants of their targets
stages (stomatal entry, commitment and differentiation) and two developmental stages disrupt canonical stomatal patterning.
(Stomatal entry and differentiation), respectively, based on the relative enrichment. B, Venn
diagrams showing overlapping and distant DE miRNAs between the SPCH-MUTE-FAMA and Ø miR399 regulates stomatal development by targeting E3 ubiquitin ligase PHO2.
EPF2-EPF1 modules at the stomatal entry or differentiation stage. ØOur data indicate an additional regulation layer of stomatal development by miRNA.