
Page 47 - I. Chemical biology and drug discovery
P. 47
Identification of Biomarkers against Acute and Chronic Exposure of
Phenol for Risk Assessment
Soee Kim, Min Kim, Yunkyung Kim and Jung-Suk Sung*
Department of Life Science, Dongguk University-Seoul, Goyang, Gyeonggi-do 410-820, South Korea
BACKGROUND AIM
The number of industrial chemical accident occurrences is increasing Widely used as polymeric materials in industrial factories and
every year, and toxic chemicals are easily absorbed into human body laboratories, phenol is metabolized in the lungs and liver when
when such accidents occur. Most deleterious chemicals absorbed in exposed to the body, causing coagulation neurosis and peripheral
the body are rapidly metabolized to other intermediate metabolites, nerve axial damage. In this study, phenol-specific biomarkers
making it difficult to evaluate the exposure level of chemicals.
Therefore, It is necessary to find biomarkers that can be detectable were identified through transcriptome analysis and confirmed in
over time after exposure to certain toxic chemicals. animal studies.
METHODS
The biomarker candidates of phenol were selected through gene ontology analysis of phenol-treated cells. BEAS-2b cells, normal cell line of
human bronchial epithelial cell, were used for transcriptome analysis. We sorted out the genes with those expression level changed more
than four times in phenol-treated cells compared to untreated control cells. The selected candidate were confirmed in vivo animal study.
The expression level of these genes in rat lung tissue was analyzed by real-time qPCR.
RESULTS
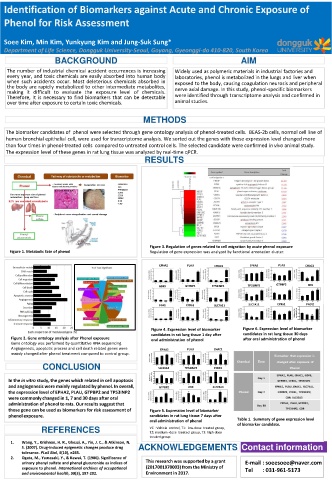
Figure 3. Regulation of genes related to cell migration by acute phenol exposure
Figure 1. Metabolic fate of phenol Regulation of gene expression was analyzed by functional annotation cluster.
EPHA2 PLAU CHAC1 EPHA2 PLAU CHAC1
GDF9 GTPBP2 TP53INP2 TP53INP2 GTPBP2 CD9
PADI2
FGF1 CYR61 SLC7A11 SLC7A11 CYR61 2.0 PADI2 ***
Relative mRNA expression [Fold] 1.5 1.0 0.5 * ***
0.0
VC P1 P2 P3
Figure 4. Expression level of biomarker Figure 6. Expression level of biomarker
candidates in rat lung tissue 1 day after candidates in rat lung tissue 30 days
Figure 2. Gene ontology analysis after Phenol exposure oral administration of phenol after oral administration of phenol
Gene ontology was performed by quantitative RNA sequencing.
Angiogenesis, apoptotic process and cell death related genes were EPHA2 PLAU CHAC1
mainly changed after phenol treatment compared to control group.
CONCLUSION SLC35A5 TP53INP2 CYR61
2.5 2.0 SLC35A5
Relative mRNA expression [Fold] 1.5 ***
In the in vitro study, the genes which related in cell apoptosis 1.0 0.5
0.0 VC P1 P2 P3
and angiogenesis were mainly regulated by phenol. In overall, GTPBP2 CD9 SLC7A11
the expression level of EPHA2, PLAU, GTPBP2 and TP53INP2
were commonly changed in 1, 7 and 30 days after oral
administration of phenol to rats. Our results suggest that
those gene can be used as biomarkers for risk assessment of Figure 5. Expression level of biomarker
phenol exposure. candidates in rat lung tissue 7 days after
oral administration of phenol Table 1. Summary of gene expression level
of biomarker candidate.
REFERENCES VC : Vehicle control, T1: low-dose treated group,
T2: medium -dose treated group, T3: high-dose
treated group
1. Wang, Y., Krishnan, H. R., Ghezzi, A., Yin, J. C., & Atkinson, N.
S. (2007). Drug-induced epigenetic changes produce drug ACKNOWLEDGEMENTS Contact information
tolerance. PLoS Biol, 5(10), e265.
2. Ogata, M., Yamasaki, Y., & Kawai, T. (1986). Significance of
urinary phenyl sulfate and phenyl glucuronide as indices of This research was supported by a grant E-mail : soeesoee@naver.com
exposure to phenol. International archives of occupational (2017001970003) from the Ministry of Tel : 031-961-5173
and environmental health, 58(3), 197-202. Environment in 2017.