
Page 5 - B.Bioinformatics and systems biology
P. 5
A bioinformatic approach to the identification of
genetic markers for idiopathic pulmonary fibrosis (IPF)
2
1
1
Sungmin Park , Seungmin Song , Junghyun Jung , Jong Wha J. Joo 1*
1 Department of Computer Science and Engineering, Dongguk University-Seoul, 04620 Seoul, South Korea
2 Department of Life Science, Dongguk University-Seoul, 04620 Seoul, South Korea
Abstract
Idiopathic pulmonary fibrosis is one of the chronic and fatal interstitial lung diseases. IPF generally shows poor prognosis, and their exact
pathogenesis and casualties are not clearly revealed yet. RNA sequencing and microarray experiments enable the determination of genes
whose expression levels are significantly different in IPF disease group compared with the healthy control group. Total 749 genes were
identified as differentially expressed genes in both two data sets via (P-value < 0.05) via oligo, limma, and DESeq R packages. Among total
DEGs, 453 genes were significantly up-regulated genes and 250 genes were down-regulated genes. In order to confirm the systemic functions
of the obtained DEGs, we performed gene set enrichment analysis and functional annotation by database for Annotation, Visualization, and
Integrated Discovery.
Methods & Materials Table 1. Table of dataset used in this study,.
-Pre-processing and Meta analysis Type Express ID Source IPF/Control
Pre-processing of datasets were performed using oligo, limma, DESeq E-GEOD-24206 17/6
Bioconductor package, and the robust multiarray average (RMA)
normalization method was used -for normalizing each microarray dataset E-GEOD-21369 23/6
separately. Microarray Lung
E-GEOD-71351 8/4
-Gene Set Enrichment Analysis tissue
Gene set enrichment analysis (GSEA) is a computational method that E-GEOD-44723 10/4
determines whether an a priori defined set of genes shows statistically
significant. RNA-Seq GSE134692 54/26
Total - - 112/46
RESULTS
-Data Collection and identifying Differentially Expressed
Genes by Meta-Analysis
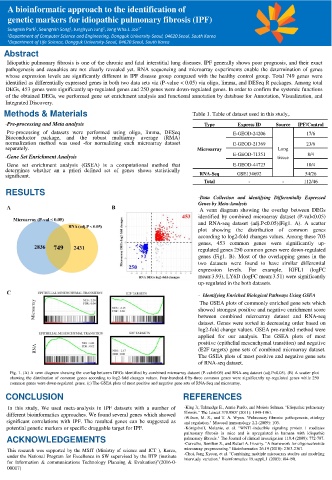
A venn diagram showing the overlap between DEGs
identified by combined microarray dataset (P-val<0.05)
and RNA-seq dataset (adj.P<0.05)(Fig1. A). A scatter
plot showing the distribution of common genes
according to log2-fold changes values. Among these 703
genes, 453 common genes were significantly up-
regulated genes 250 common genes were down-regulated
genes (Fig1. B). Most of the overlapping genes in the
two datasets were found to have similar differential
expression levels. For example, IGFL1 (logFC
mean:3.93), LY6D (logFC mean:3.51) were significantly
up-regulated in the both datasets.
- Identifying Enriched Biological Pathways Using GSEA
The GSEA plots of commonly enriched gene sets which
showed strongest positive and negative enrichment score
between combined microarray dataset and RNA-seq
dataset. Genes were sorted in decreasing order based on
log2-fold change values. GSEA pre-ranked method were
applied for our analysis. The GSEA plots of most
positive (epithelial mesenchymal transition) and negative
(E2F targets) gene sets of combined microarray dataset.
The GSEA plots of most positive and negative gene sets
of RNA-seq dataset.
Fig. 1. (A) A venn diagram showing the overlap between DEGs identified by combined microarray dataset (P-val<0.05) and RNA-seq dataset (adj.P<0.05). (B) A scatter plot
showing the distribution of common genes according to log2-fold changes values. Four-hundred-fifty-three common genes were significantly up-regulated genes while 250
common genes were down-regulated genes. (c) The GSEA plots of most positive and negative gene sets of RNA-Seq and microarray.
CONCLUSION REFERENCES
In this study, We used meta-analysis in IPF datasets with a number of -King Jr, Talmadge E., Annie Pardo, and Moisés Selman. "Idiopathic pulmonary
different bioinformatics approaches. We found several genes which showed fibrosis." The Lancet 378.9807 (2011): 1949-1961.
-Wilson, M. S., and T. A. Wynn. "Pulmonary fibrosis: pathogenesis, etiology
significant correlations with IPF. The resulted genes can be suggested as and regulation." Mucosal immunology 2.2 (2009): 103.
potential genetic markers or specific druggable target for IPF. -Königshoff, Melanie, et al. "WNT1-inducible signaling protein–1 mediates
pulmonary fibrosis in mice and is upregulated in humans with idiopathic
ACKNOWLEDGEMENTS pulmonary fibrosis." The Journal of clinical investigation 119.4 (2009): 772-787.
-Carvalho, Benilton S., and Rafael A. Irizarry. "A framework for oligonucleotide
This research was supported by the MSIT (Ministry of science and ICT ), Korea, microarray preprocessing." Bioinformatics 26.19 (2010): 2363-2367.
under the National Program for Excellence in SW supervised by the IITP (institute -Choi, Jung Kyoon, et al. "Combining multiple microarray studies and modeling
interstudy variation." Bioinformatics 19.suppl_1 (2003): i84-i90.
for Information & communications Technology Planning & Evaluation)”(2016-0-
00017)