Page 1 - B.Bioinformatics and systems biology
P. 1

Integrating binding and expression data to predict transcription factors com-


                  bined function


                  Mahmoud Ahmed and Deok Ryong Kim


                  Department of Biochemistry and Convergence Medical Sciences and Institute of Health Sciences, Gyeongsang National University School of Medicine, Jinju, Korea


               Summary                                                                                                                                                                                                                                                                                                                                 Table 1: Functions of the target R package.


               Background Transcription factor binding to the regulatory region of a gene induces or represses its gene expression.                                                                                                                                           Function                               Description                                                                           Input                                              Output

               Transcription factors share their binding sites with other factors, co-factors and/or DNA-binding proteins. These pro-
                                                                                                                                                                                                                                                                              merge ranges                           Merge overlapping peaks & regions.                                                    peaks & regions                                    Merged ranges
               teins form complexes which bind to the DNA as one-units. The binding of two factors to a shared site does not always
                                                                                                                                                                                                                                                                              find distance                           Calculate the distance between the centers peaks & regions                                                                               Distances
               lead to a functional interaction. Results We propose a method to predict the combined functions of two factors using
                                                                                                                                                                                                                                                                                                                     of peaks & regions.
               comparable binding and expression data (target) (Figure 1). We based this method on binding and expression target
                                                                                                                                                                                                                                                                              score peaks                            Calculate regulatory scores for peaks in Distances                                                                                       Peak scores

               analysis (BETA), which we re-implemented in R and extended for this purpose (Table 1). target ranks the factor’s
                                                                                                                                                                                                                                                                                                                     relation to regions.
               targets by importance and predicts the dominant type of interaction between two transcription factors. We applied the
                                                                                                                                                                                                                                                                              score regions                          Calculate regulatory scores for regions.                                              Peak scores & region Regions scores
               method to simulated and real datasets of transcription factor-binding sites and gene expression under perturbation of
                                                                                                                                                                                                                                                                                                                                                                                                           IDs
               factors. Yin Yang 1 transcription factor (YY1) and YY2 are evolutionary and functionally related. The knockdown of
                                                                                                                                                                                                                                                                              rank product                           Rank regions based on the regulatory po- Regions scores, expres- Regions rank products
               either factors produced wide changes in the gene expression of HeLa cells (Figure 2). We found that YY1 and YY2
                                                                                                                                                                                                                                                                                                                     tential & expression statistics.                                                      sion statistics & region
               have antagonistic and independent regulatory targets in HeLa cells, but they may cooperate on a few shared targets
                                                                                                                                                                                                                                                                                                                                                                                                           IDs
               (Figure 3 & Table 2). Conclusion We developed an R package and a web application to integrate binding (ChIP-seq)


               and expression (microarrays or RNA-seq) data to determine the cooperative or competitive combined function of two                                                                                                                                              associated peaksSelect overlapping peaks & regions & peaks & regions                                                                                                            Assigned peaks

               transcription factors.                                                                                                                                                                                                                                                                                calculate a score for each peak in relation


                                                                                                                                                                                                                                                                                                                     to a region.

                                                                                                                                                                                                                                                                              direct target                          Select & rank regions with overlapping peaks & regions                                                                                   Assigned targets

               Background                                                                                                                                                                                                                                                                                            peaks.


                                                                                                                                                                                                                                                                              plot predictions Plot the ECDF of the regions’ ranks by Ranks & group factor                                                                                                    ECDF plot
               The integration of the overlapping binding sites and the effect of the gene expression of perturbed factors can be
                                                                                                                                                                                                                                                                                                                     group.
               used to infer their combined function; cooperative or competitive. Two factors work cooperatively when they share a

                                                                                                                                                                                                                                                                              test predictions Test the ECDF of the ranks in the regions Ranks & group factor                                                                                                 t-statistics & p-values
               binding site and where they both induce or repress the gene [2]. By contrast, two factors may compete on a specific

                                                                                                                                                                                                                                                                                                                     in each group are from different distribu-
               sites where the binding of either has an effect on the gene expression opposite to the other [3]. In this study, we pro-
                                                                                                                                                                                                                                                                                                                     tion.
               vide an implementation of an algorithm to integrate the binding and expression data to predict transcription factors


               direct target and extend the method to predict the combined functions of two factors using comparable binding and

               expression data.                                                                                                                                                                                                                                           Results


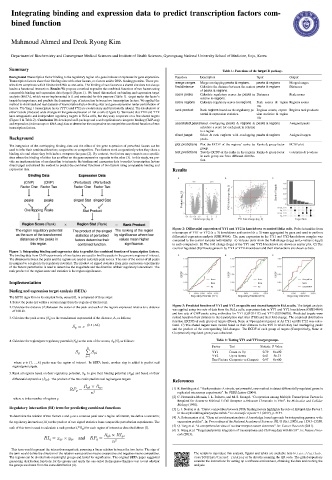
                                                                                                                                                                                                                                                                          Figure 2: Differential expression of YY1 and YY2 in knockdown vs control HeLa cells. Probe intensities from


                                                                                                                                                                                                                                                                          microarrays of YY1 or YY2 (n = 3) knockdown and control (n = 3) were aggregated by gene and used to perform


                                                                                                                                                                                                                                                                          differential expression analysis (GSE14964). The gene expression in the YY1 and YY2-knockdown samples was


                                                                                                                                                                                                                                                                          compared to the control samples individually. A) Volcano plots show the fold-change (log ) and p-values (-log 0)
                                                                                                                                                                                                                                                                                                                                                                                                                                                                                                           1
                                                                                                                                                                                                                                                                                                                                                                                                                                                                 2
                                                                                                                                                                                                                                                                          in each comparison. B) The fold-change (log ) of the YY1 and YY2-knockdown are shown as scatter plot. C) The
                                                                                                                                                                                                                                                                                                                                                                     2

                                                                                                                                                                                                                                                                          count of regulated (Up/Down) genes in by YY1 or YY2-knockdown and their intersections are shown as bars.

               Figure 1: Integrating binding and expression data to predict the combined function of transcription factors.


               The binding data from ChIP experiments of two factors are used to find the peaks in the genomic regions of interest.


               The distances between the peaks and the regions are used to calculate peak scores. The sum of the scores of all peaks

               in assigned to a region is its regulatory potential. The product of signed statistics from gene expression experiments


               of the factors perturbation is used to determine the magnitude and the direction of their regulatory interactions. The


               rank product of the region score and statistics is the region significance.


               Implementation


               Binding and expression target analysis (BETA)


               The BETA algorithm in its simplest form, minus [6], is composed of three steps:


                1. Select the peaks (p) within a certain range from the regions of interest (g).

                                                                                                                                                                                                                                                                          Figure 3: Predicted function of YY1 and YY2 on specific and shared targets in HeLa cells. The target analysis
                2. Calculate the distance (∆) between the center of the peak and each of the regions expressed relative to a distance
                                                                                                                                                                                                                                                                          was applied using two sets of data from the HeLa cells; expression data in YY1 and YY2-knockdown (GSE14964)
                    of 100 kb.

                                                                                                                                                                                                                                                                          and two sets of ChIP peaks using antibodies for YY1 (GSE31417) and YY2 (GSE96878). Predicted targets were


                3. Calculate the peak scores (S ) as the transformed exponential of the distance, ∆, as follows;                                                                                                                                                          ranked based on their distance to the transcription start sites (TSS) and their fold-change. The empirical distribution
                                                                             p
                                                                                                                                                                                                                                                                          function (ECDF) of each group of targets (Down, None or Up-regulated genes) of A) YY1 and B) YY2 was calcu-


                                                                                                                S = e              −(0.5+4∆)                                                                                                                              lated. C) The shared targets were ranked based on their distance to the TSS in which they had overlapping peaks
                                                                                                                    p
                                                                                                                                                                                                                                                                          and the product of the corresponding fold-changes. The ECDF of each group of targets (Competitively, None or


                                                                                                                                                                                                                                                                          Cooperatively regulated genes) was calculated.


                4. Calculate the region/gene regulatory potential (S ) as the sum of the scores, S [5], as follows:                                                                                                                                                                                                                           Table 2: Testing YY1 and YY2 target groups.
                                                                                                                     g
                                                                                                                                                                               p

                                                                                                                                                                                                                                                                                                                                       Factor                     Test                                           Statistic P Value
                                                                                                                                       k

                                                                                                                                     X
                                                                                                                     S =                     S    pi                                                                                                                                                                                   YY1                        Down vs Up                                         0.79            0e+00
                                                                                                                         g

                                                                                                                                     i=1                                                                                                                                                                                               YY2                        Up vs Down                                         0.41             5e-13

                                                                                                                                                                                                                                                                                                                                       Two Factors Cooperate vs Compete                                              0.97            0e+00

                      where p is {1, ..., k} peaks near the region of interest. In BETA basic, another step is added to predict real

                    region/gene targets.


                5. Rank all regions based on their regulatory potential, S , to give their binding potential (R ) and based on their
                                                                                                                                  g
                                                                                                                                                                                                          gb


                    differential expression (R ). The product of the two ranks predicts real region/gene targets.
                                                                       ge
                                                                                                                                                                                                                                                                          References


                                                                                                                                  R × R                   ge
                                                                                                                                       gb
                                                                                                            RP =                                                                                                                                                          [1] R. Breitling et al. “Rank products: A simple, yet powerful, new method to detect differentially regulated genes in
                                                                                                                      g
                                                                                                                                             n   2                                                                                                                                replicated microarray experiments”. In: FEBS Letters (2004).


                                                                                                                                                                                                                                                                          [2] C. Hernandez-Munain, J. L. Roberts, and M. S. Krangel. “Cooperation among Multiple Transcription Factors Is
                      where n is the number of regions g.

                                                                                                                                                                                                                                                                                  Required for Access to Minimal T-Cell Receptor α-Enhancer Chromatin In Vivo”. In: Molecular and Cellular

                                                                                                                                                                                                                                                                                  Biology (1998).

               Regulatory interaction (RI) term for predicting combined functions                                                                                                                                                                                         [3] L. J. Norton et al. “Direct competition between DNA binding factors highlights the role of Kr¨ uppel-like Factor 1


                                                                                                                                                                                                                                                                                  in the erythroid/megakaryocyte switch.” In: Scientific reports 7.1 (2017), p. 3137.

               To determine the relation of two factors x and y on a common peak near a region of interest, we define a new term;
                                                                                                                                                                                                                                                                          [4] A. Subramanian et al. “Gene set enrichment analysis: A knowledge-based approach for interpreting genome-wide


               the regulatory interaction (RI) as the product of two signed statistics from comparable perturbation experiments. The                                                                                                                                              expression profiles”. In: Proceedings of the National Academy of Sciences 102.43 (Oct. 2005), pp. 15545–15550.


                                                                                                                                                                                                                                                                          [5] Q. Tang et al. “A comprehensive view of nuclear receptor cancer cistromes”. In: Cancer Research (2011).
               rank of this term is used to calculate a rank product (PR ) for each region of interest as described above [1].
                                                                                                                               g
                                                                                                                                                                                                                                                                          [6] S. Wang et al. “Target analysis by integration of transcriptome and ChIP-seq data with BETA”. In: Nature Proto-


                                                                                                                                                                 R × RI                     ge                                                                                    cols (2013).
                                                                                                                                                                      gb
                                                                    RI = x × y                                ge          and RP =
                                                                                             ge
                                                                             g
                                                                                                                                                     g
                                                                                                                                                                              n   2


                  This term would represent the interaction magnitude assuming a linear relation between the two factor. The sign of


               the term would define the direction of the relation were positive means cooperative and negative means competitive.                                                                                                                                                                          The scripts to reproduce this analysis, figures and tables are available here https://github.


               The regions can be divided into meaningful groups and tested for significance. The original BETA paper suggested                                                                                                                                                                             com/BCMSLab/target_ranking or by directly scanning the QR code. The github repository

               generating distribution functions for the groups and apply the one-tailed Kolmogorov-Smirnov test to test whether                                                                                                                                                                           contains the instructions for setting up a software environment, obtaining the data and running the


               the groups are drawn from the same distribution [4].                                                                                                                                                                                                                                        analysis.
   1   2   3   4   5   6