
Page 33 - A. Aging
P. 33
Standardization of visual phenotype in aging mice
2
Hae-Sol Shin 1,2,* ; Jinu Han, MD ; Hong Kyung Kim ; Yejin Cho ; Soo Jung Han ;
1
4
3,*
5
1
4
1,6
Jiyeon Kim ; Jihei Sara Lee, MD ; Hyoung-Chin Kim ; Ki Taek Nam ; *Kyoung Yul Seo, MD 1,2,6,**
1 Department of Ophthalmology, Severance Hospital, Institute of Vision Research, Yonsei University College of Medicine, Seoul, Korea
2 Korea Mouse Sensory Phenotyping Center (KMSPC), Yonsei University College of Medicine, Seoul, Republic of Korea
3Department of Ophthalmology, Gangnam Severance Hospital, Institute of Vision Research, Yonsei University College of Medicine, Seoul, Korea
4 Severance Biomedical Science Institute, Brain Korea 21 PLUS Project for Medical Science, Yonsei University College of Medicine, Seoul, Korea
5 Laboratory Animal Resource Center, Division of Bioinfrastructure, Korea Research Institute of Bioscience and Biotechnology
6 Brain Korea 21 Plus Project for Medical Science, Yonsei University, Seoul, Republic of Korea
*These two authors contributed equally.
BACKGROUND AIM
Age is the most important risk factor for various eye disorders such as dry eye Increased concerns about the effect of aging on the sensory organs
syndrome, cataract, age-related macular degeneration, and glaucoma. necessitate standardized and detailed characterization of normal visual
function. Applying methods used in clinical practice is one of the best ways to
Visual function continuously declines with age. For instance, the number of
neurons in the retina decreases, leading to the loss of visual acuity and sensitivity. correlate human and mouse phenotype data.
A decrease in amplitudes on electroretinograms(ERG) and structural In this study, we analyzed the virtual optokinetic movement, biomicroscopic
abnormalities related to photoreceptor cell death with normal aging have also lens photos, ERG, and retinal thickness in mice to present the standard
been observed in both animal and human studies. phenotypes of aged mice.
METHODS
Animals Optical Coherence Tomography(OCT)
For analysis, both male and female C57BL/6J mice at 16 weeks (n=4), 48 weeks (n=10), and OCT scans were taken using the Micron® IV (Phoenix Research
96 weeks (n=5) were obtained. Mice were provided from the Korea Mouse Phenotyping Labs, Pleasanton, CA, USA). After anesthesia,Fundus photographs
Center. and OCT scans were acquired. The retinal thickness was measured
using the InSight- Animal OCT Segmentation Software (Phoenix
Optokinetic nystagumus(OKN) Research Labs, CA, USA).
Visual acuity were measured by optokinetic nystagumus(OKN) using Electroretinogram (ERG)
a virtual optokinetic system (OptoMotry, Cerebral Mechanics,
Medicine Hat, Alberta, Canada).A video camera connected to a ERG was recorded using Micron Ganzfeld ERG (Phoenix
computer was placed on the ceiling of the device for recording. The Research Labs, Pleasanton CA, USA). Mice were placed in a dark
gratings moved in either right or left directions so that a clockwise environment for at least 12 hours for dark adaptation prior to
rotation generated tracking in the left eye while a counterclockwise scotopic testing (Rod cell response). Scotopic ERGs in response
rotation tested tracking in the right eye. to increasing flash intensities were obtained, ranging from -1.7 log
cd·s/m2 to 1.9 log cd·s/m2. Photopic ERGs were then obtained
with increasing flash intensities, ranging from -0.5 log cd·s/m2 to
4.1 log cd·s/m2. Ten responses to light stimulation were averaged.
RESULTS
▣ Morphological examination Figure 1 Figure 3
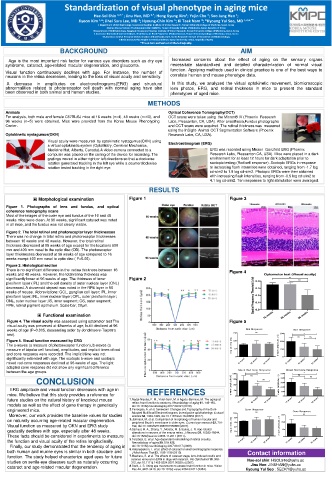
Figure 1. Photographs of lens and fundus, and optical
coherence tomography scans
Most of the images of the outer eye and fundus of the 16 and 48
weeks mice were clean. At 96 weeks, significant cataract was noted
in all mice, and the fundus was not clearly visible.
Figure 2. The total retinal and photoreceptor layer thicknesses
There was no change in total retina and photoreceptor thicknesses
between 16 weeks and 48 weeks. However, the total retinal
thickness decreased at 96 weeks of age except for the locations 600
mm and 400 mm nasal to the optic disc (OD). The photoreceptor
layer thicknesses decreased at 96 weeks of age compared to 16
weeks except 400 mm nasal to optic disc ( P<0.05).
Figure 3. Histological section
There is no significant difference in the retina thickness between 16 Figure 4
weeks and 48 weeks. However, the total retina thickness was
significantly lower at 96 weeks of age. The thickness of inner Figure 2
plexiform layer (IPL) and the cell density of outer nuclear layer (ONL)
decreased. A drusenoid deposit was noted in the RPE layer in 96
weeks of mouse. Abbreviations: GCL, ganglion cell layer; IPL, inner
plexiform layer; INL, inner nuclear layer; OPL, outer plexiform layer;
ONL, outer nuclear layer; IS, inner segment; OS, outer segment;
RPE, retinal pigment epithelium. Scale bar; 20µm.
▣ Functional examination
Figure 4. The visual acuity was assessed using optomotor test The Figure 5
visual acuity was preserved at 48weeks of age, but it declined at 96
weeks of age (P=0.005, descending order by Jonckheere-Terpstra Rod Response Rod Response
test). 150 ns 300 ns *
Figure 5. Visual function measured by ERG 100 200 ns
The a-waves (a measure of photoreceptor function), b-waves (a implicit time (ms) b- wave (amplitude μ V)
measure of bipolar cell function), amplitudes, and implicit times of rod 50 100
and cone response were recorded. The implicit time was not
significantly extended with age. The scotopic b-wave and scotopic 0 0
mixed rod-cone responses declined at 96 weeks of age. The light 16 weeks 48 weeks 96 weeks 16 weeks 48 weeks 96 weeks
adapted cone response did not show any significant difference
between the age groups. Mixed Rod Cone Response Mixed Rod Cone Response
**
200 ns 500 ns ** ns
CONCLUSION 150 ns 400
300
ERG amplitude and visual function decreases with age in REFERENCES a- wave (amplitude uV) 100 50 b- wave (amplitude μ V) 200
100
mice. We believe that this study provides a reference for 0 0
future studies on the natural history of knockout mouse 1.Nadal-Nicolas, F. M., Vidal-Sanz, M. & Agudo-Barriuso, M. The aging rat 16 weeks 48 weeks 96 weeks 16 weeks 48 weeks 96 weeks
models as well as the effect of gene therapy in genetically retina: from function to anatomy. Neurobiology of aging 61, 146-168,
doi:10.1016/j.neurobiolaging.2017.09.021 (2018).
engineered mice. 2.Panorgias, A. et al. Senescent Changes and Topography of the Dark- Cone Response Cone Response
Adapted Multifocal Electroretinogram. Investigative ophthalmology & visual
ns
Moreover, our work provides the baseline values for studies science 58, 1323-1329, doi:10.1167/iovs.16-20953 (2017). 100 150 ns
on naturally occurring age-related macular degeneration. 3..Johnson, M. et al. Comparison of morphology of human macular and 80 60 100
peripheral Bruch's membrane in older eyes. Current eye research 32, 791-
Visual function as measured by OKN and ERG study 799, doi:10.1080/02713680701550660 (2007). implicit time (ms) 40 b- wave (amplitude μ V)
gradually declines with age, especially after 48 weeks. 4.Samuel, M. A., Zhang, Y., Meister, M. & Sanes, J. R. Age-related 20 50
alterations in neurons of the mouse retina. J Neurosci 31, 16033-16044,
These facts should be considered in experiments to measure doi:10.1523/jneurosci.3580-11.2011 (2011). 0 0
the function and visual acuity of the retina longitudinally. 5.Terzibasi, E. et al. Age-dependent remodelling of retinal circuitry. 16 weeks 48 weeks 96 weeks 16 weeks 48 weeks 96 weeks
Neurobiology of aging 30, 819-828,
Finally, our study demonstrated that the tendency of aging in doi:10.1016/j.neurobiolaging.2007.08.017 (2009).
both human and murine eyes is similar in both structure and 6.Ratanapakorn, T. et al. Effect of cataract on electroretinographic response. Contact information
J Med Assoc Thai 93, 1196-1199 (2010).
function. The study helped characterize aged eyes for future 7.Maehara, S. et al. The effects of cataract stage, lens-induced uveitis and
cataract removal on ERG in dogs with cataract. Vet Ophthalmol 10, 308-
studies on senile eye diseases such as naturally occurring 312, doi:10.1111/j.1463-5224.2007.00559.x (2007). Hae-sol shin: HSOL916@yuhs.ac
Jinu Han: JINUHAN@yuhs.ac
cataract and age-related macular degeneration. 8.Stahl, J. S. Using eye movements to assess brain function in mice. Vision
Res 44, 3401-3410, doi:10.1016/j.visres.2004.09.011 (2004). Kyoung Yul Seo : SEOKY@yuhs.ac