
Page 209 - 2020년김해시통계연보
P. 209
Electricity·Gas·Water-Supply 207
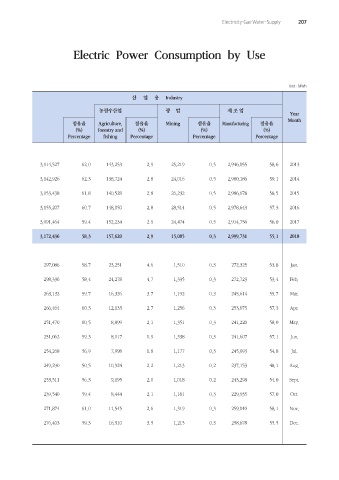
Electric Power Consumption by Use
Unit : MWh
산 업 용 Industry
농림수산업 광 업 제 조 업
Year
Month
점유율 Agriculture, 점유율 Mining 점유율 Manufacturing 점유율
(%) forestry and (%) (%) (%)
Percentage fishing Percentage Percentage Percentage
3,114,527 62.0 143,253 2.9 25,219 0.5 2,946,055 58.6 2013
3,142,926 62.3 138,724 2.8 24,016 0.5 2,980,186 59.1 2014
3,153,438 61.8 140,528 2.8 26,232 0.5 2,986,678 58.5 2015
3,155,207 60.7 148,050 2.8 28,514 0.5 2,978,643 57.3 2016
3,091,464 59.4 152,234 2.9 24,474 0.5 2,914,756 56.0 2017
3,172,436 58.3 157,620 2.9 15,085 0.3 2,999,731 55.1 2018
297,086 58.7 23,251 4.6 1,510 0.3 272,325 53.8 Jan.
298,336 58.4 24,278 4.7 1,335 0.3 272,723 53.4 Feb.
263,132 59.7 16,326 3.7 1,192 0.3 245,614 55.7 Mar.
266,464 60.3 12,133 2.7 1,256 0.3 253,075 57.3 Apr.
251,470 60.5 8,899 2.1 1,351 0.3 241,220 58.0 May.
251,062 59.3 8,117 1.9 1,338 0.3 241,607 57.1 Jun.
254,268 56.9 7,998 1.8 1,177 0.3 245,093 54.8 Jul.
249,290 50.5 10,924 2.2 1,213 0.2 237,153 48.1 Aug.
253,511 56.3 9,195 2.0 1,018 0.2 243,298 54.0 Sept.
239,540 59.4 8,444 2.1 1,161 0.3 229,935 57.0 Oct.
271,874 61.0 11,545 2.6 1,319 0.3 259,010 58.1 Nov.
276,403 59.3 16,510 3.5 1,215 0.3 258,678 55.5 Dec.