
Page 203 - 2020년김해시통계연보
P. 203
Mining, Manufacturing and Energy 201
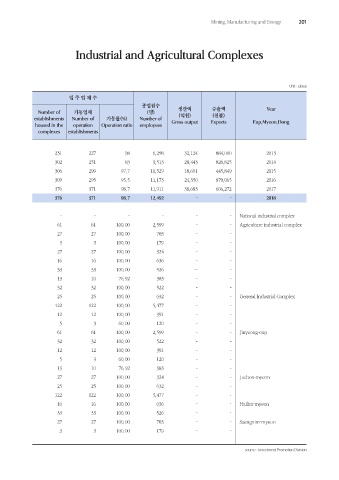
Industrial and Agricultural Complexes
Unit : place
입 주 업 체 수
종업원수 생산액 수출액 Year
Number of 가동업체 (명)
(천불)
(억원)
establishments Number of 가동률(%) Number of Gross output Exports Eup,Myeon,Dong
housed in the operation Operation ratio employees
complexes establishments
231 227 98 6,298 32,124 884,000 2013
302 251 83 9,513 28,443 826,825 2014
306 299 97.7 10,529 18,691 445,849 2015
309 295 95.5 11,173 24,350 879,065 2016
376 371 98.7 11,911 38,683 606,272 2017
376 371 98.7 12,492 - - 2018
- - - - - - National industrial complex
61 61 100.00 2,599 - - Agriculture industrial complex
27 27 100.00 703 - -
3 3 100.00 179 - -
27 27 100.00 324 - -
16 16 100.00 636 - -
33 33 100.00 526 -- -
13 10 76.92 383 - -
32 32 100.00 522 - -
25 25 100.00 632 - - General Industrial Complex
122 122 100.00 5,477 - -
12 12 100.00 391 - -
5 3 60.00 120 - -
61 61 100.00 2,599 - - Jinyeong-eup
32 32 100.00 522 - -
12 12 100.00 391 - -
5 3 60.00 120 - -
13 10 76.92 383 - -
27 27 100.00 324 - - Juchon-myeon
25 25 100.00 632 - -
122 122 100.00 5,477 - -
16 16 100.00 636 - - Hallim-myeon
33 33 100.00 526 - -
27 27 100.00 703 - - Saengnim-myeon
3 3 100.00 179 - -
source : Investment Promotion Division