Page 332 - ebook
P. 332

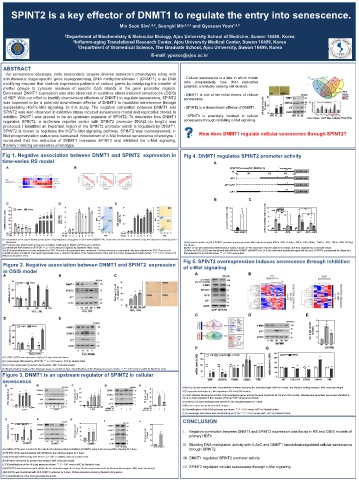
SPINT2 is a key effector of DNMT1 to regulate the entry into senescence.


                                                                                                                                                                           Min Seok Sim                              1,2,3    , Seongki Min                            1,2,3       and Gyesoon Yoon                                         1,2,3


                                                                                             1  Department of Biochemistry & Molecular Biology, Ajou University School of Medicine, Suwon 16499, Korea


                                                                                                         2  Inflamm-aging Translational Research Center, Ajou University Medical Center, Suwon 16499, Korea


                                                                                                               3  Department of Biomedical Science, The Graduate School, Ajou University, Suwon 16499, Korea


                                                                                                                                                                                                                        E-mail: ypeace@ajou.ac.kr


      ABSTRACT


          As senescence develops, cells sequentially acquire diverse senescent phenotypes along with


      simultaneous stage-specific gene reprogramming. DNA methyltransferase 1 (DNMT1) is an DNA                                                                                                                                                                       - Cellular senescence is a fate in which mitotic


      modifying enzyme that controls expression patterns of various genes by catalyzing the transfer of                                                                                                                                                               cells            progressively                      lose            their           replicative


      methyl groups to cytosine residues of specific CpG islands in the gene promoter regions.                                                                                                                                                                        potential, eventually ceasing cell division.


      Decreased DNMT1 expression was also observed in oxidative stress-induced senescence (OSIS)                                                                                                                                                                      - DNMT1 is one of the initial drivers of cellular


      of HDF. With our effort to identify downstream effectors of DNMT1 to regulate senescence, SPINT2                                                                                                                                                                senescence.


      was expected to be a potential downstream effector of DNMT1 to modulate senescence through


      suppressing HGF/c-Met signaling. In this study, The negative correlation between DNMT1 and                                                                                                                                                                      - SPINT2 is a downstream effector of DNMT1.


      SPINT2 was also observed in oxidative stress induced senescence model and replicative model. In


      addition, DNMT1 was proved to be an upstream regulator of SPINT2. To determine how DNMT1                                                                                                                                                                        - SPINT2 is potentially involved in cellular                                                                                                                                   J Biol Chem . 2017 Mar 3;292(9):3729-3739


      regulates SPINT2, a luciferase reporter vector with SPINT2 promoter DNA(2 kb length) was                                                                                                                                                                        senescence through inhibiting c-Met signaling.


      produced. I identified an important region of the SPINT2 promoter which is regulated by DNMT1.


      SPINT2 is known to regulates the HGF/c-Met signaling pathway. SPINT2 was overexpressed, c-


      Met phosphorylation status was decreased. Knockdown of c-Met induced senescence phenotype. I                                                                                                                                                                                          How does DNMT1 regulate cellular senescence through SPINT2?


      concluded that the reduction of DNMT1 increases SPINT2 and inhibited the c-Met signaling,


      thereby inducing senescence phenotype.


     Fig 1. Negative association between DNMT1 and SPINT2 expression in                                                                                                                                                                                               Fig 4. DNMT1 regulates SPINT2 promoter activity


     time-series RS model


    (A) Generation of the above heatmap was done using Morpheus using gene in RS models(GSE41714). Rows and columns were clustered using the hierarchal clustering tool in
          Morpheus.                                                                                                                                                                                                                                                    (A)Schematic models of pGL4-SPINT2 promoter reporter plasmids with indicated length(-839 to +300, 1140bp, -268 to +300, 569bp, -2000 to -839, -268 to +300, 1423bp)

    (B) P values were determined by Pearson correlation coefficient for DNMT1,SPINT2 and CDKN1A.                                                                                                                                                                       are shown.
    (C) messenger RNA levels by qRT-PCR. **, p < 0.01 versus DT2(pd32) by Student's t test.  (A,B)                                                                                                                                                                     (B)HDF (DT2) was transfected with the pGL4 -basic or pGL4- SPINT2-promoter reporter plasmid for 4days, and then subjected to a promoter assay.
    (D,E)Cell granularity increase was estimated by SSC. Percent cell populations were monitored. Cell size increase in suspended cells was estimated by FSC. Percent cell                                                                                             (C)After an HDFs (DT2) was transfected with siRNA for DNMT1 (siDNMT1) for 24 h, the cells were transfected again with the pGL4-SPINT2 -pro plasmid for 3days and

    populations were monitored. Each point represents mean ± standard deviation of the measurements of the cells from three independent culture plates. **, P < 0.01 versus DT2                                                                                        then subjected to a promoter assay  **, p < 0.01 versus siNC
    (PD31) by Student's t-test.

                                                                                                                                                                                                                                                                      Fig 5. SPINT2 overexpression induces senescence through inhibition

      Figure 2. Negative association between DNMT1 and SPINT2  expression                                                                                                                                                                                             of c-Met signaling


      in OSIS model


    (A-E) HDFs (DT2) was exposed to H O for 3 days indicated doses.
                                                        2
                                                            2
    (A,C) messenger RNA level by qRT-PCR. **, p < 0.01 versus. DT2 by student t-test.


    (B,D) Protein expression by western blot analysis. MW, molecular weight.

    (E) Representative images of the SA-β-gal assay. C, control; d, days. Quantifications of the SA-β-gal assay are shown. **, P < 0.01 versus control by Student's t-test.


     Figure 3. DNMT1 is an upstream regulator of SPINT2 in cellular


     senescence


                                                                                                                                                                                                                                                                     (A)HDF(DT2) was transfected with a recombinant lentivirus harboring the indicated target cDNA for 4 days. and Western blotting analyses. MW, molecular weight.

                                                                                                                                                                                                                                                                     (B) Expression heatmaps of c-Met signaling in RS and OSIS models.


                                                                                                                                                                                                                                                                     (C) Venn diagram showing the number of the overlapping genes among the gene signatures for RS and OSIS models. Nineteen and seventeen genes were identified to
                                                                                                                                                                                                                                                                     be up or down regulated in the progress of the two HDF senescence models.

                                                                                                                                                                                                                                                                     (D,E)HDF(DT2) was transfected with siRNAs for the indicated targets for 4 days.


                                                                                                                                                                                                                                                                     (D)Protein expression by western blot analysis

                                                                                                                                                                                                                                                                     (E) Quantifications of the SA-β-gal assay are shown. **, P < 0.01 versus siNC by Student's t-test.


                                                                                                                                                                                                                                                                     (F,G) messenger RNA levels were monitored by qRT-PCR. **, P < 0.01 versus siNC, GFP by Student's t-test.


                                                                                                                                                                                                                                                                     CONCLUSION


                                                                                                                                                                                                                                                                      I.      Negative correlation between DNMT1 and SPINT2 expression was found in RS and OSIS models of


                                                                                                                                                                                                                                                                              primary HDFs


                                                                                                                                                                                                                                                                      II. Blocking DNA methylation activity with 5-AzC and DNMT1 knockdown regulated cellular senescence


     (A-C)HDFs (DT2) were exposed to the indicated for pharmacological inhibition of DNMT1 using 5-aza deoxycytidine (Sigma) for 3 days.                                                                                                                                      through SPINT2


     (D-F)HDFs (DT2) was transfected with siRNAs for the indicated targets for 4 days.

     (A,D)messenger RNA level by qRT-PCR **, p < 0.01 vs. DMSO, siNC by student t-test.                                                                                                                                                                               III. DNMT1 regulated SPINT2 promoter activity


     (B,E)Protein expression by western blot analysis. MW, molecular weight.

     (C,F)Quantifications of the SA-β-gal assay are shown. **, P < 0.01 versus siNC by Student's t-test.

     (G)HDF(DT2) was transfected with siRNAs for the indicated targets for 4 days. Protein expression levels by Western blot analysis. MW, molecular weight.                                                                                                          IV. SPINT2 regulated cellular senescence through c-Met signaling


     (I)HDF(DT2) was transfected with GFP-SPINT2 Lentivirus for 4 days. Protein expression levels by Western blot analysis.

     (H,J) Quantifications of the SA-β-gal assay are shown.
   327   328   329   330   331   332